
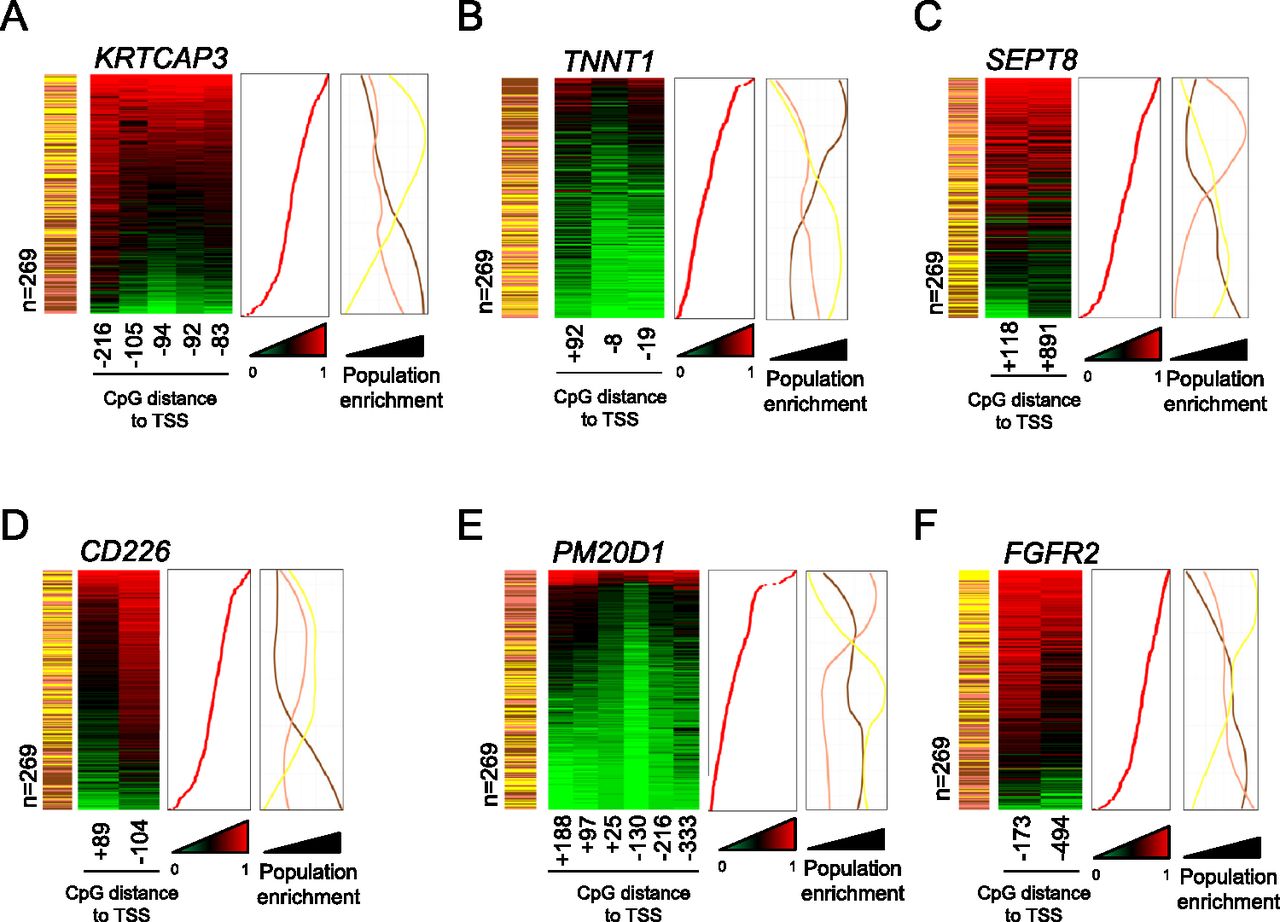
Figure 2.
Differentially methylated gene promoters of KRTCAP3 (A), TNNT1 (B), SEPT8 (C), CD226 (D), PM20D1 (E), and FGFR2 (F) in Han Chinese-American (yellow), Caucasian-American (pink), and African-American (brown) individuals. Absolute DNA methylation levels at population-specific CpG sites in gene promoters (low: green; high: red) are displayed for single individuals (n = 269). The distance to the gene transcription start site is indicated. The samples are ranked according to their average DNA methylation levels (middle panel) at displayed pop-CpGs. Population enrichment (right panel) is illustrated using absolute sample numbers in a 10-sample window.


