
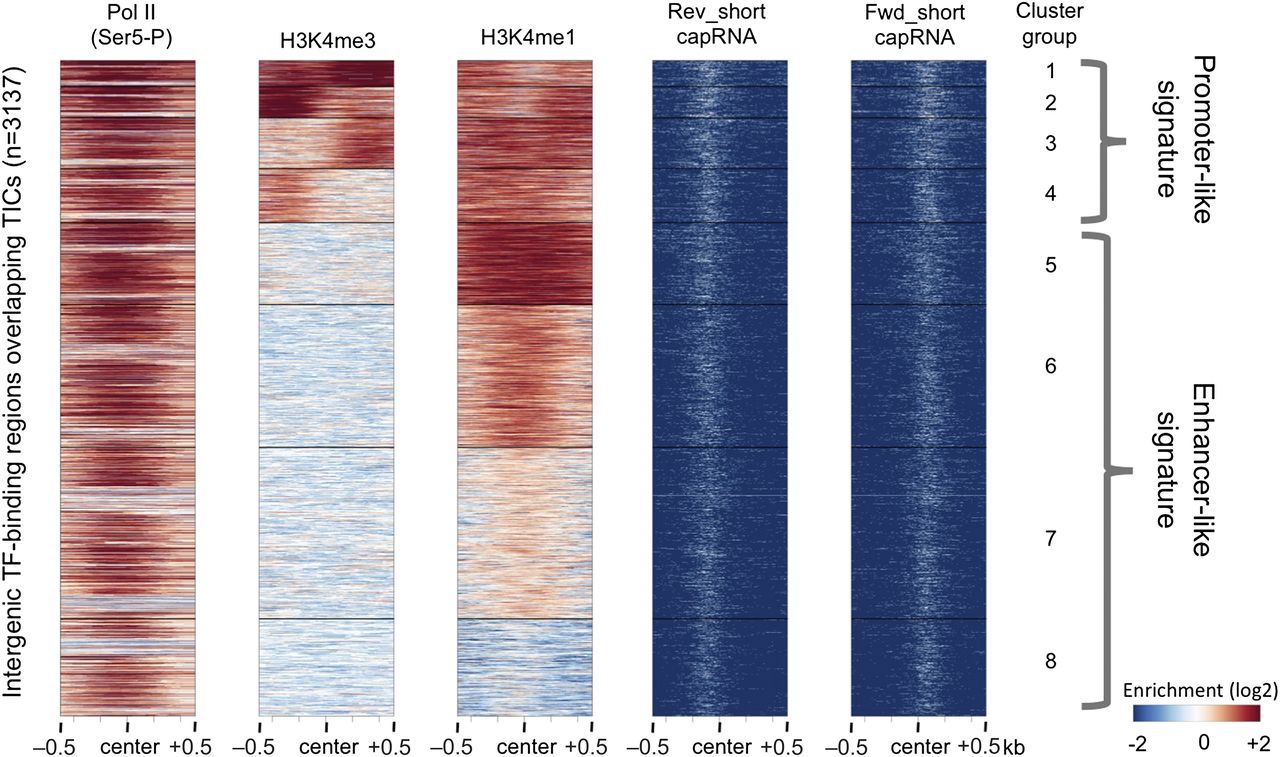
Figure 5.
Intergenic TF-binding regions overlapping TICs are enriched for enhancer-like chromatin signature. Heat map analysis for the indicated enrichment signals displayed as 8 k-means clustered groups based on H3K4me3 and H3K4me1 (n = 3137). All signals were plotted in 2-kb windows centered at the midpoint of TF-binding regions. A promoter-like signature of high H3K4me3/low H3K4me1 is found in clusters 1– 4 (n = 776). In contrast, clusters 5–8 show an enhancer-like chromatin signature, high H3K4me1 and low/under-enriched H3K4me3 (n = 2361).


