
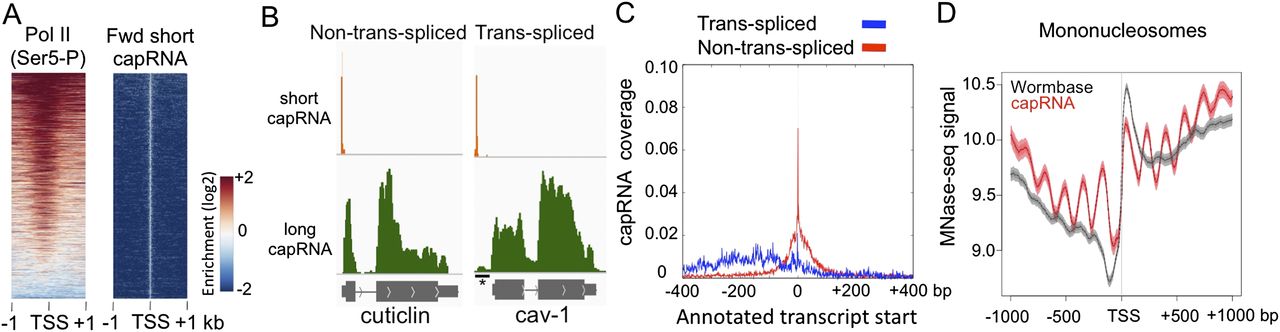
Transcription initiation regions (TICs) are occupied by RNA Pol II and enriched near the 5′ end of coding genes. (A) Heat map displays of forward strand TICs (n = 36,662) ranked by enrichment of Pol II Ser5 ChIP-chip signal. All panels are plotted for the enrichment of signal in 2-kb windows centered at cap RNA TSSs. (B) Genome browser views of short cap RNA (orange) and long cap RNA (green) signals at a non-trans-spliced and a trans-spliced gene. (*) The outron region. (C) The fraction sites where at least two cap RNA starts were analyzed relative to WormBase transcript start sites of trans-spliced (blue) and non-trans-spliced (red) genes are plotted in an 800-bp window. (D) Mononucleosome signal (adult) anchored at either cap RNA TSSs (red) or WormBase transcript starts (gray).


