
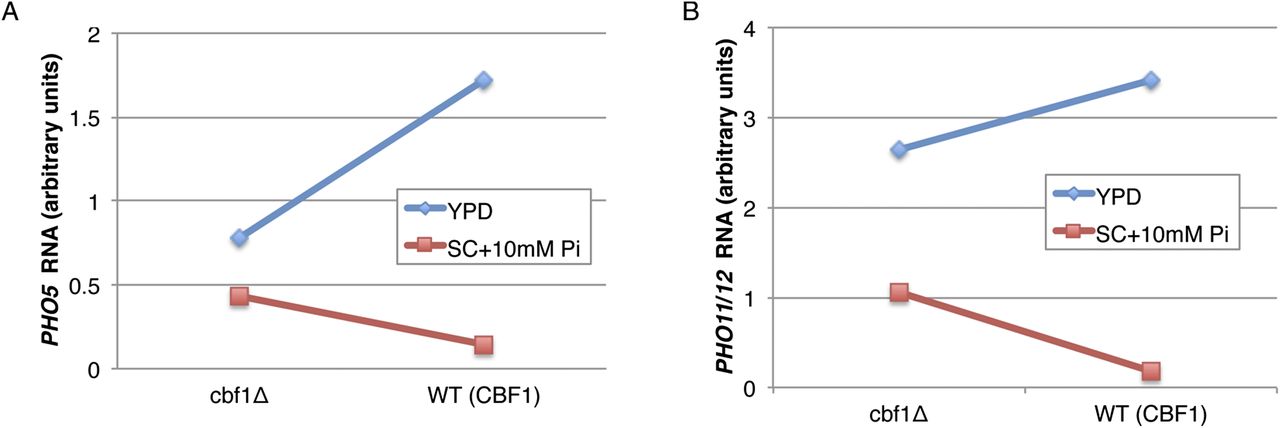
Figure 4.
Effect of Cbf1 on expression of acid phosphatases in cells grown in synthetic complete medium with 10 mM inorganic phosphate (red) or on cells grown in YPD (blue). (A) Expression of PHO5. (B) Combined expression of PHO11 and PHO12, which have so much sequence similarity that we were not able to distinguish their transcripts. Error bars representing one standard error of the mean of two technical replicates were too small to be seen in the figure.


