
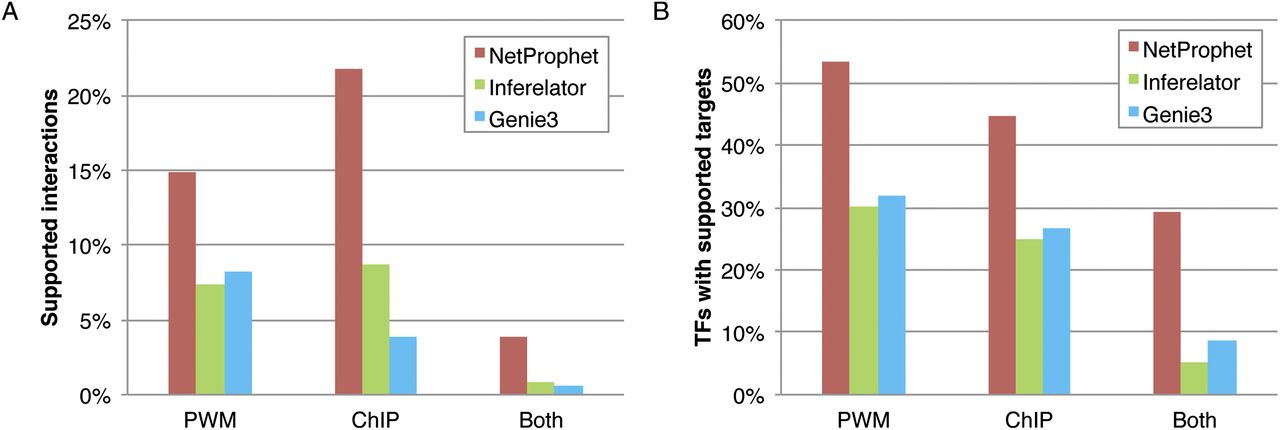
Figure 3.
Evaluation of top 4000 predictions from NetProphet (red), Inferelator (green), and GENIE3 (blue). (A) For each method, percentage of predictions supported by binding potential at the high stringency PWM threshold, ChIP data, or both. (B) Percentage of TFs for which at least one of the top five targets predicted by each method is supported by either binding potential or ChIP hits or both. (See Supplemental Methods for additional details.)


