
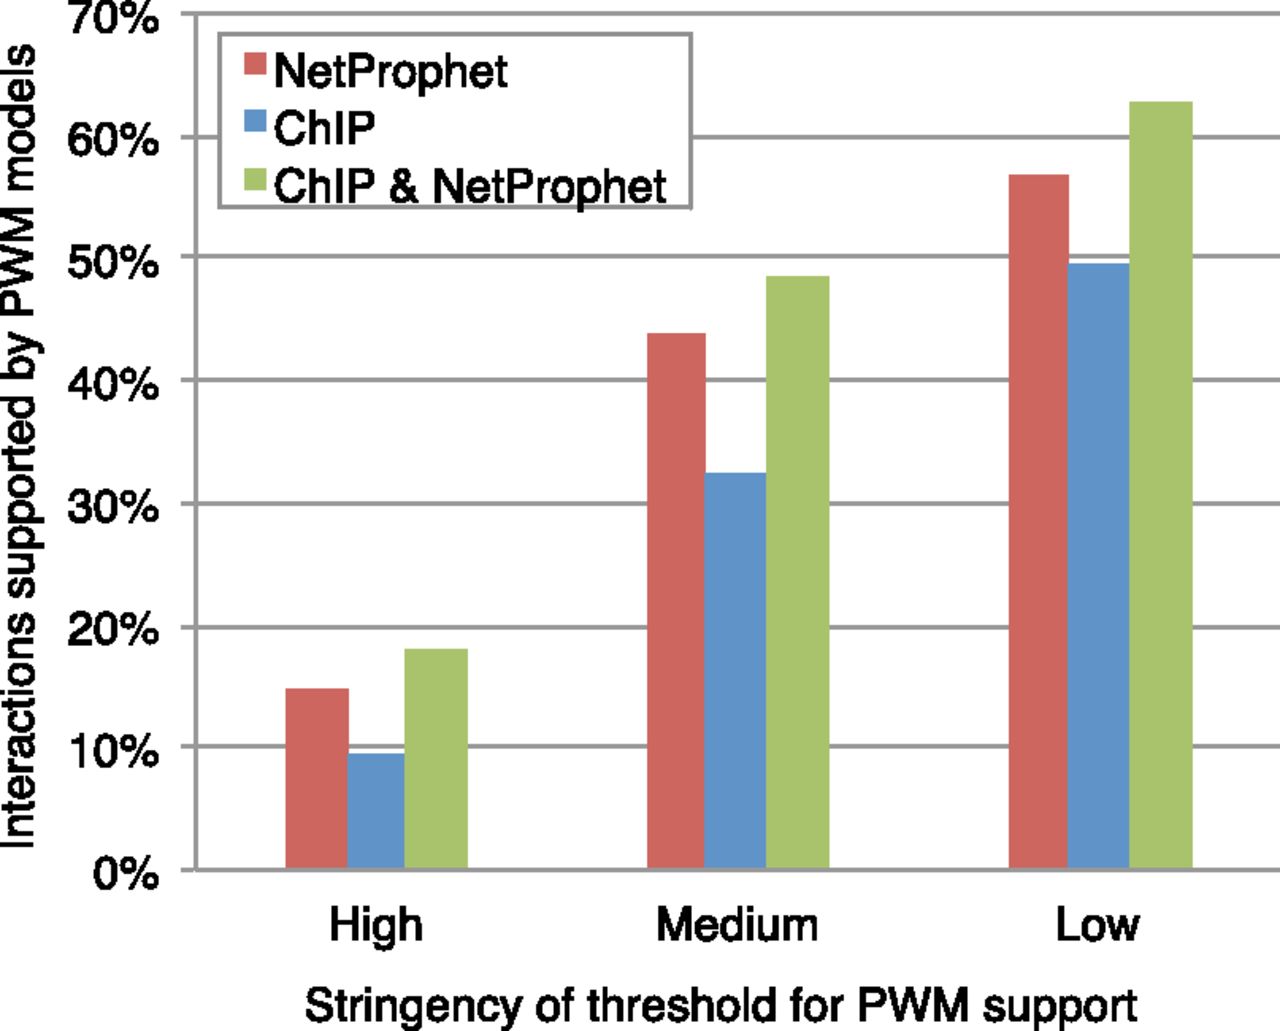
TF-promoter binding potential for the top 4000 NetProphet predictions (red), all direct targets implicated by ChIP hits in the Yeastract or Tnet data bases (blue), and targets implicated by ChIP hits that are also predicted by NetProphet (green). The high stringency threshold for each PWM was set such that ∼10% of ChIP-implicated targets have PWM scores exceeding the threshold and hence count as “PWM supported.” The medium and low stringency thresholds were set such that ∼33% and ∼50% of ChIP-implicated targets for each TF have PWM scores exceeding the threshold, respectively. For the high, medium, and low stringency PWM cutoffs, chance inclusion was 6.4%, 22.1%, and 36.8%, respectively.


