
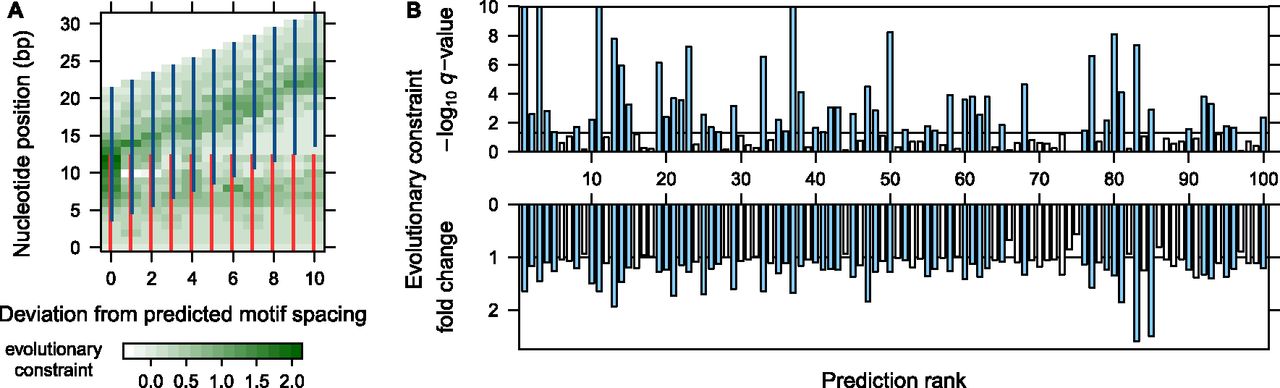
Evolutionary constraint signatures of predicted motif complexes. (A) Example of FOXA1 (HNF3A) homodimer, ranked 11th and predicted in LNCaP (prostate cancer) cells. Again, we considered the predicted motif complex (first column) and its 10 incorrectly spaced variants. At each nucleotide position, color intensity indicates the average phyloP constraint score, weighted by information content at the corresponding motif position (see Methods). Evolutionary constraint is highest at the predicted motif spacing. (B) Evolutionary constraint q-values and fold change for the top 100 predicted motif complexes. Evolutionary constraint scores were calculated for each predicted motif complex and its 10 incorrectly spaced variants (see Methods). For each prediction, we tested whether the corresponding motif complex instances were enriched for evolutionary constraint relative to the remaining 10 spacings. We show the corresponding q-values (top) and fold changes (bottom) of evolutionary constraint scores between the predicted motif complex and its incorrectly spaced variants. Predictions with q-value below 0.05 are indicated by blue bars in both plots.


