
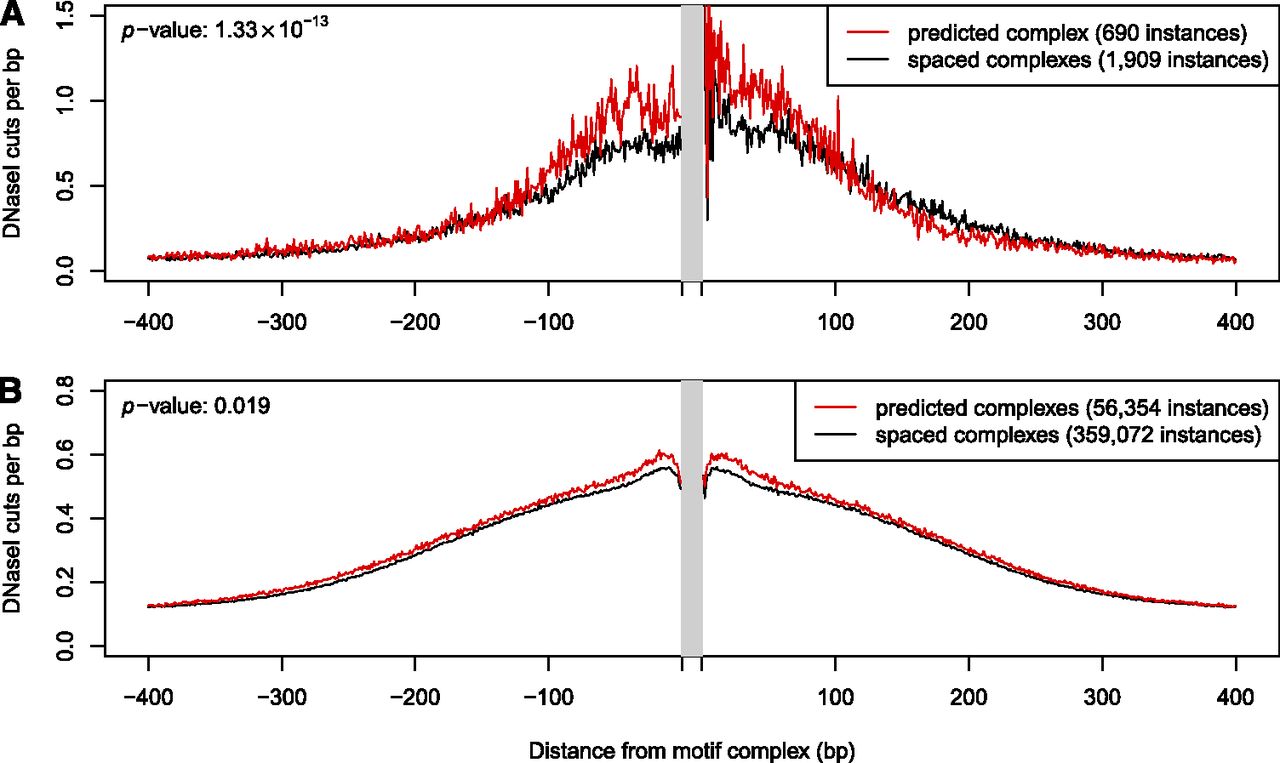
DNase I cut density near predicted and incorrectly spaced motif complexes. (A) Example of AR–FOXA1. The average number of DNase I cuts in LNCaP-specific hypersensitive sites is shown in the vicinity of AR–FOXA1 motif complex instances. (Red curve) DNase I cut density averaged over 690 instances of the predicted AR–FOXA1 motif complex (we predict that AR–FOXA1 heterodimer binds at these locations in LNCaP cells). (Black curve) DNase I cut density averaged over 1909 instances of incorrectly spaced AR–FOXA1 motif complexes (wider than the predicted spacing by 1–10 bp). The DNase I cut density is significantly higher within ±100 bp of the predicted heterodimer binding sites. (B) Similar to A: DNase I cut density averaged over the 54 predicted motif complexes that failed to show significant enrichment for DNase I cuts when analyzed individually (see Methods).


