
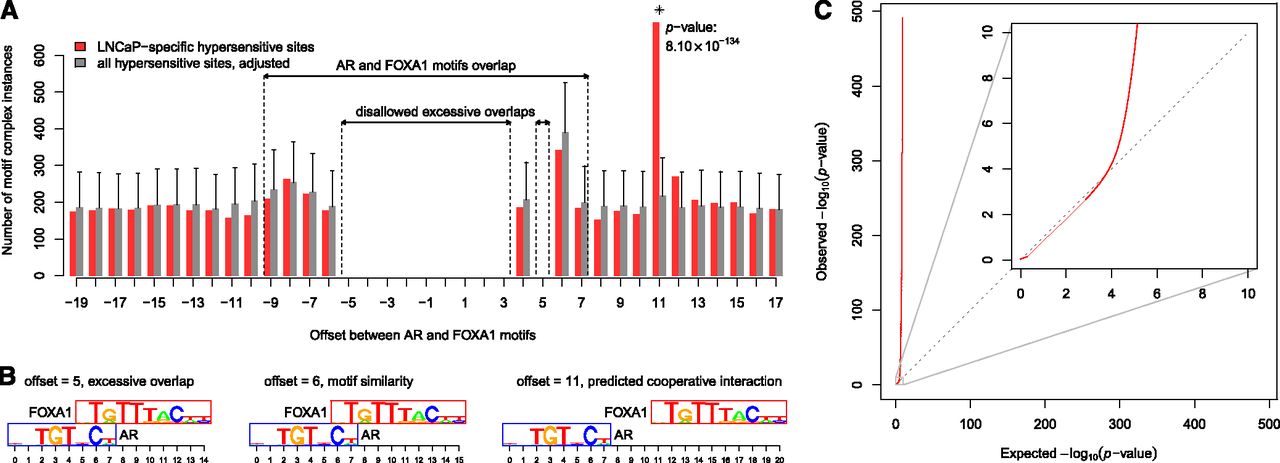
Identification of overrepresented cell-type–specific motif complexes. (A) Example of overrepresented motif complex specific to LNCaP (prostate cancer) cells. Number of instances of AR–FOXA1 motif complexes within LNCaP-specific hypersensitive sites (red bars) as a function of motif offset. Gray bars denote the expectation based on the background set of all hypersensitive sites (see Methods). Offsets in the interval [−9, 7] correspond to complexes with overlapping motifs. Offsets disallowed due to excessive motif overlap (see Methods) are indicated. Error bars correspond to P = 0.05 after Bonferroni correction. The complex with offset 11, marked with an asterisk, was the only one overrepresented in LNCaP-specific hypersensitive sites; its Bonferroni-corrected P-value is indicated. (B) Examples of AR–FOXA1 motif complexes at three different offsets; (C) Q-Q plot of observed vs. expected log10 P-values of motif complex enrichment in all ∼1.4 billion hypotheses tested. (Inset) Magnification of the first 10 decades of Q-Q plot. The calculated P-values fit the null expectation over the first four decades, indicating appropriate choice of statistical model.


