
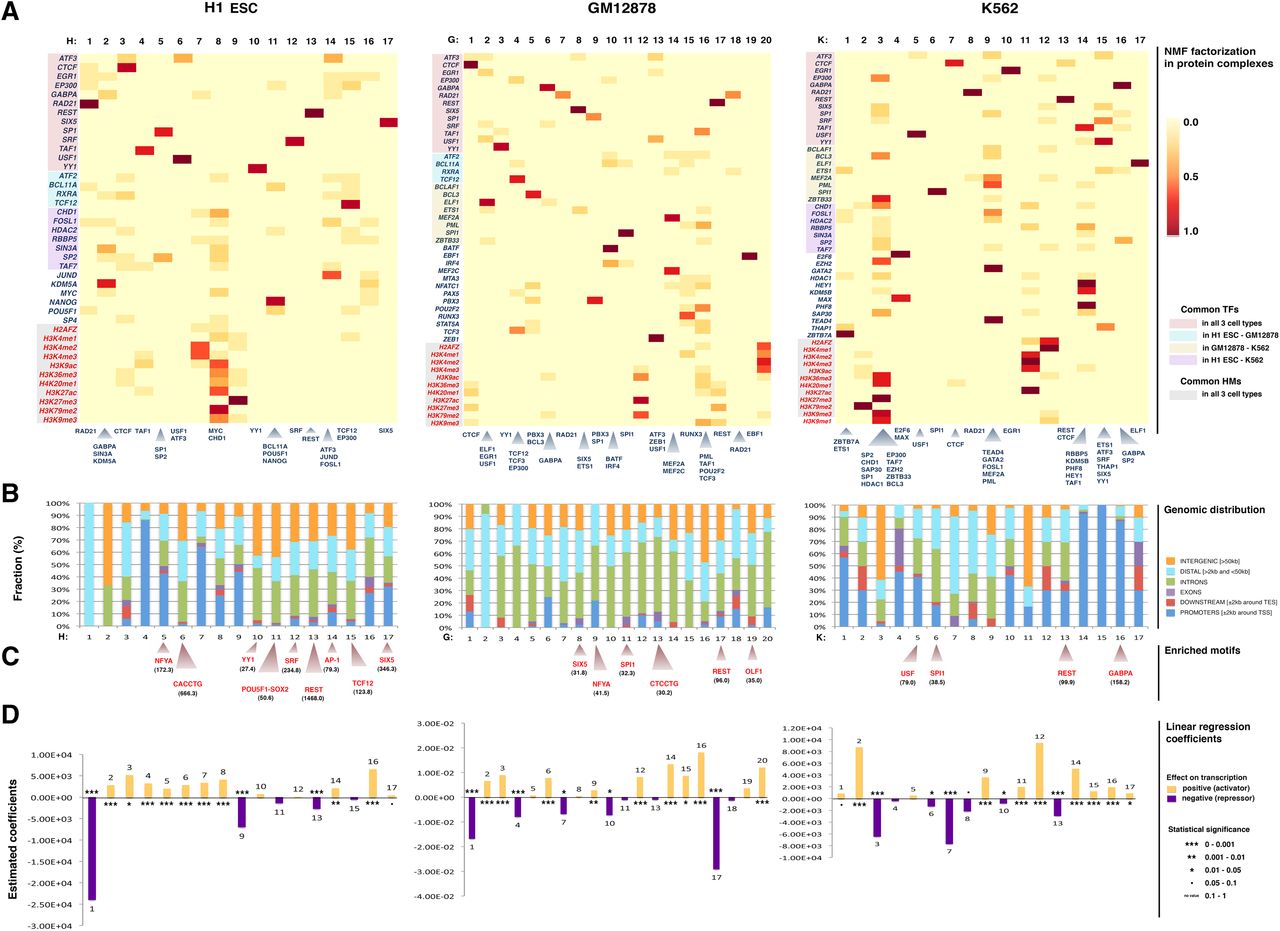
Predicted complexes in three human cell types. (A) The heatmaps visualize the NMF coefficients matrices for the three cell types. (Columns) The detected complexes; (rows) the reads density binding pattern of the corresponding TF/HM experiment for each complex. The rows of the heatmaps are ordered, and groups of TFs and HMs are color-coded in five groups, indicating common TFs in all three cell types (light red), common between H1 ESC and GM12878 only (light blue), common between GM12878 and K562 only (light yellow), common between H1 ESC and K562 only (light purple), and common HMs in all three cell types (light gray). TFs and HMs that are not highlighted depict data sets available only for the corresponding cell type (at the time of submission). The cells depict the relative contribution of each complex to an experiment. All experiments are shown on the left of the heatmaps (HMs red, TFs blue). The TFs whose corresponding complex coefficient is >0.3 (and represent on average the top 5% of the NMF coefficients matrixes) are shown below each complex. These factors were strictly considered as complex members only for the protein–protein interaction analysis. (B) Genomic distribution of the complex-specific CREs and categorization in promoters (±2 kb around TSS), downstream extremities (±2 kb around TES), exons, introns, distal (>2 kb and <50 kb), and intergenic regions (>50 kb). (C) Regulatory motif analysis revealed the most enriched motifs for the complex-specific CREs. The z-scores for each predicted motif appears in parentheses. The motif logos are shown in Supplemental Figure 3. (D) The linear regression coefficients for each complex. The size of the coefficient corresponds to the size of the effect that each complex has on gene expression, and the sign of the coefficient (positive or negative) gives the direction of the effect. Statistical significance of the estimated coefficients is coded as: (***) 0 < P < 0.001; (**) 0.001 < P < 0.01; (*) 0.01 < P < 0.05; (•) 0.05 < P < 0.1; no value, 0.1 < P < 1.


