
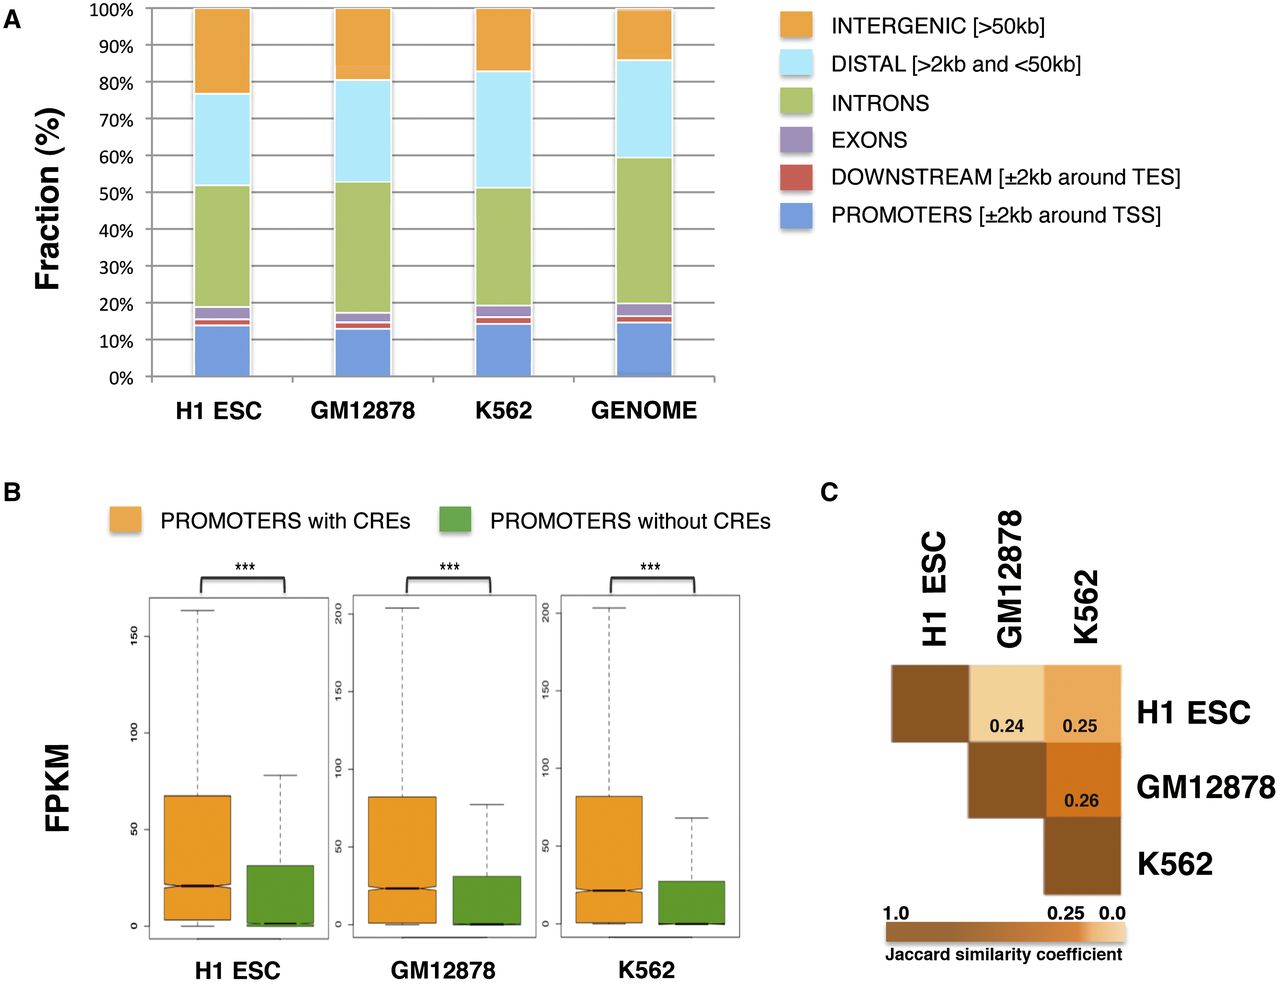
Analysis of the CREs of three human cell types. (A) Genomic distribution of CREs and categorization in promoters (±2 kb around TSS), downstream extremities (±2 kb around TES), exons, introns, distal (>2 kb and <50 kb), and intergenic regions (>50 kb). CREs span multiple genomic regions in a fashion that agrees with the fraction of the human genome (hg19) in the above categories. (B) Boxplots showing that genes with CREs in their promoters (±2 kb around TSS) have significantly higher expression than genes not occupied by them, across all cell types. The y-axis shows absolute transcript expression levels measured by FPKM (fragments per kilobase of exon per million fragments mapped). P-values were calculated by Wilcoxon rank sum test. Three asterisks (***) indicate P-value < 2.2 × 10⁻¹⁶. (C) The Jaccard similarity coefficients are shown, indicating how similar the CREs are across the three cell types. The larger the coefficient, the more similar two peak sets are in terms of overlapping regions. Low coefficients of similarity are observed between the three cell types, supporting a cell-type–specific character of the detected CREs.


