
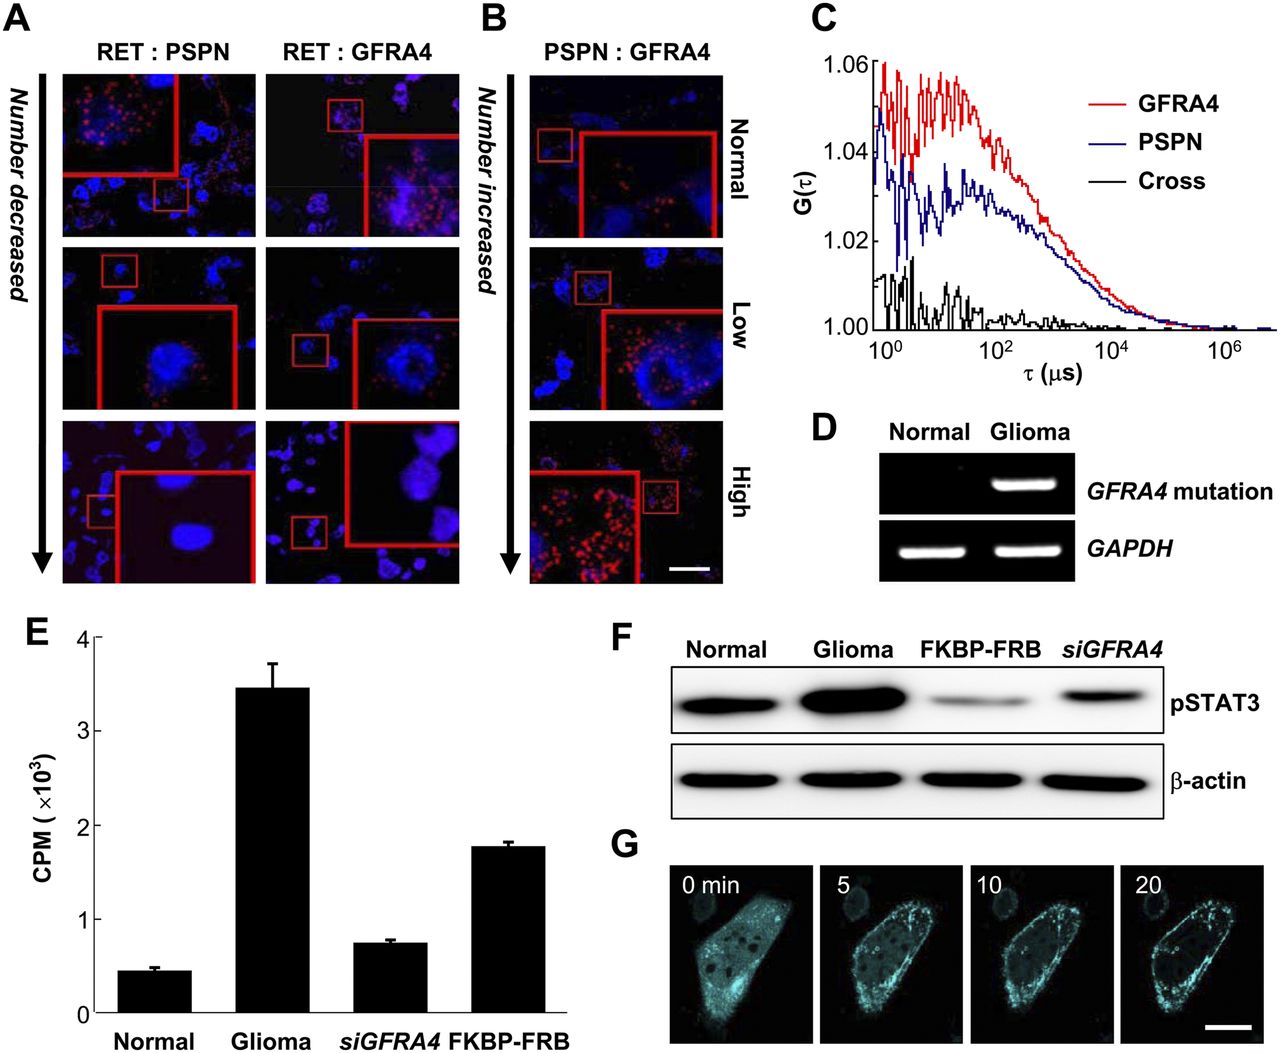
Dynamics of the GFRA4/PSPN/RET complex in glioma. (A,B) A proximity ligation assay was used to measure groups of close physical interactions between RET and PSPN, RET and GFRA4, and PSPN and GFRA4 in normal brain and glioma tissues. Red spots indicate physical proximity of the corresponding protein pair. Insets: 4× magnification. Scale bar, 20 μm. (C) Two fluorescence autocorrelation functions, G(τ), of GFP-PSPN (blue), TagRFP-GFRA4 (red), and one cross-correlation function (black), calculated from time traces of fluorescent fluctuations with high-grade glioma primary cells, as a function of correlation lag time τ (μs). (D) Reverse transcription-PCR of GFRA4 with axon 2 mutation. (E) Cell proliferation assay using thymidine incorporation in high-grade glioma cells with (“siGFRA4”) or without GFRA4 silencing (“glioma”), and using rapamycin for GFRA4 redirection to the plasma membrane (“FKBP-FBP”) in high-grade primary glioma cells. Bars indicate radioactivity in counts per minute (CPM; average ± standard deviation). (F) Immunoblot results using primary high-grade glioma (Glioma, FKBP-FRB, siGFRA4) and normal brain (Normal) cells. (G) Snapshots of GFRA4 redirection to the plasma membrane using the rapamycin technique in high-grade glioma cells. (Cyan) GFRA4. Scale bar, 100 μm.


