
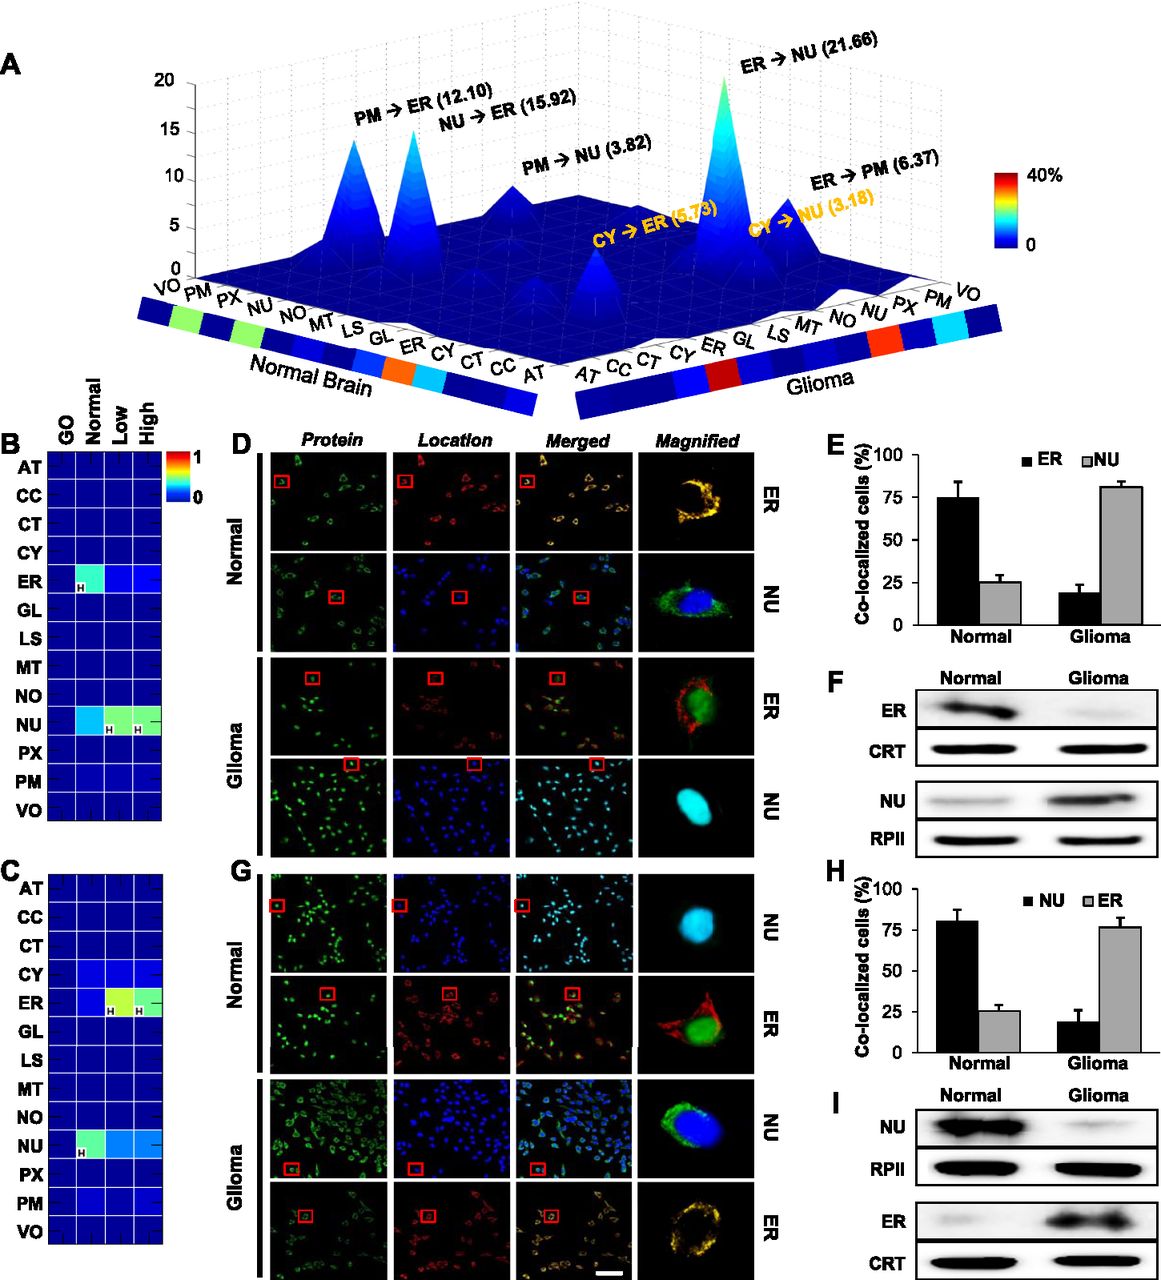
The landscape of protein mislocations in human glioma. (A) The landscape of mislocations in glioma. Each peak (z-axis) corresponds to the percentage of these mislocation candidates moving from one location (x-axis) to another (y-axis). Colors along the x and y margins represent the total percentage of proteins mislocating out of or into a location, respectively. (B,C) Conditional location maps of RNF138 and TLX3 are shown as examples of the most common mislocations from the ER to the nucleus (NU) or from the NU to ER, respectively. The color indicates degree of possibility and “H” indicates the location with the highest degree of possibility within each condition. (D–I) Validation of RNF138 (D) and TLX3 (G) using confocal images for normal brain and glioma tissues. Confirmation of RNF138 (E,F) and TLX3 (H,I) mislocations by population assay and Western blot analyses using normal brain and glioma primary cells. For the population assay, samples from four normal and five glioma subjects were used. (Green) RNF138 or TLX3, (red) ER, (blue) NU, (CRT) calreticulin for an ER marker, (RPII) RNA polymerase II for nucleus. Scale bar, 5 μm.


