
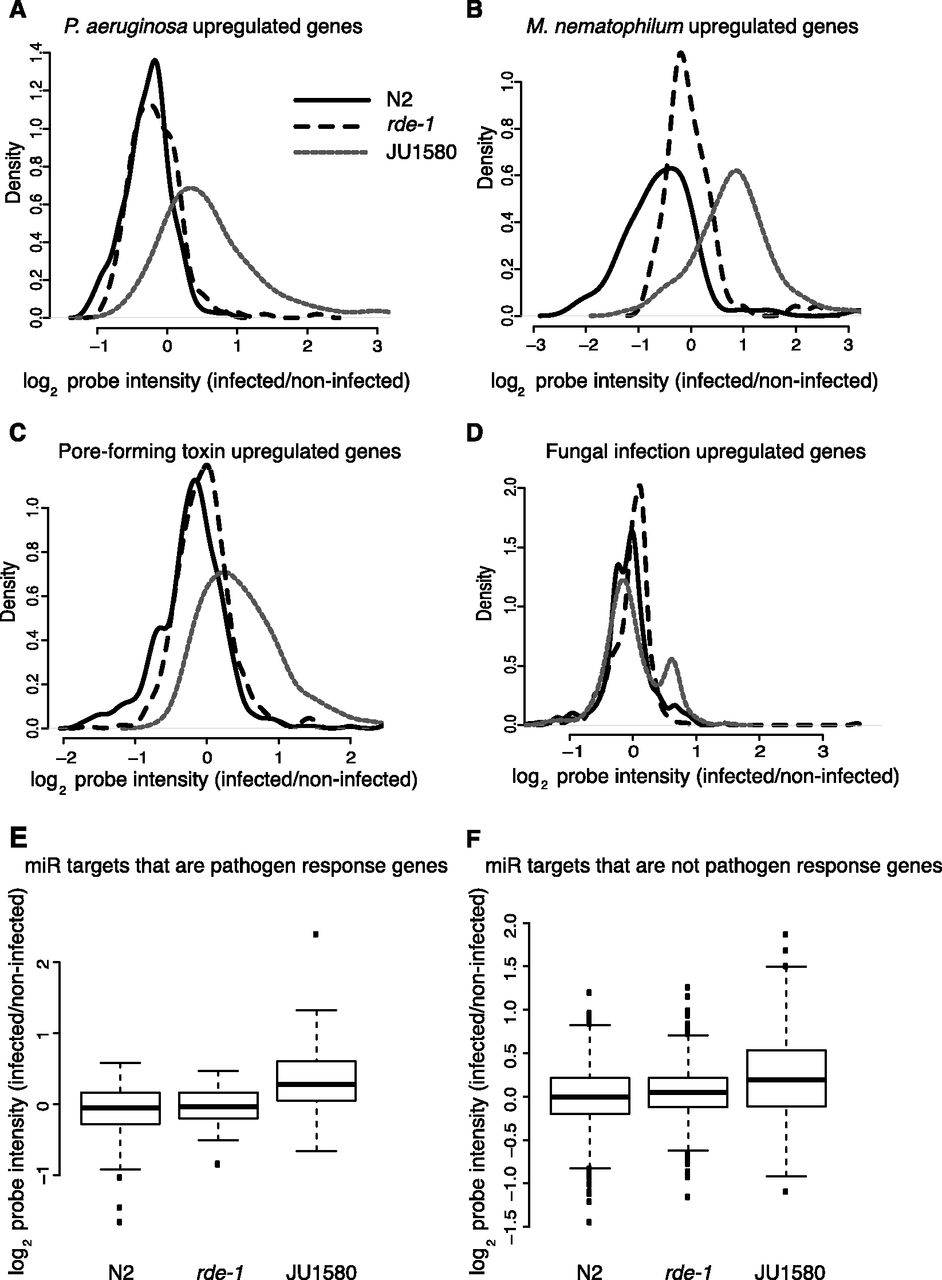
Figure 5.
Behavior of previously annotated pathogen response genes upon viral infection of C. elegans. (A–D) Changes upon viral infection in various sets of pathogen-regulated genes, as indicated above the panels. Density plots show the mean changes across all biological replicates. (E,F) The gene expression changes upon viral infection for microRNA targets divided into pathogen response genes and genes not previously annotated as pathogen response genes, respectively. Boxes show median and interquartile range, and the whiskers extend to the most extreme data point, which is no more than 1.5 times the interquartile range from the box. Dots represent outliers.


