
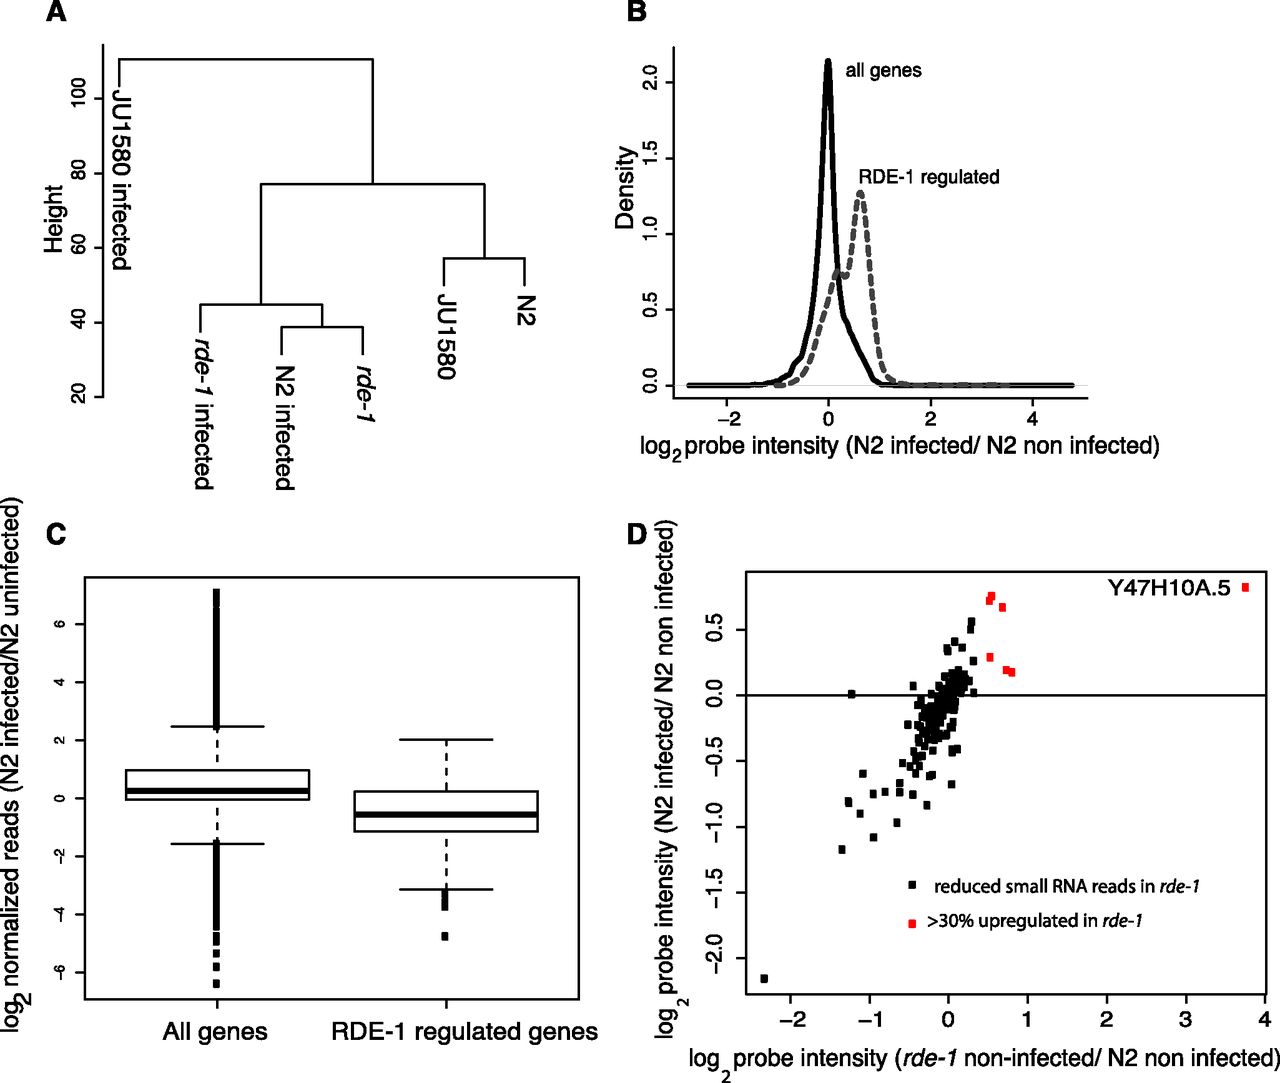
Similarity between rde-1 mutants and virally infected N2 animals. (A) Hierarchical clustering performed on all the probes, averaged over all biological replicates, for infected and uninfected strains as indicated. (B) The behavior of RDE-1-regulated genes (defined as being 30% or more up-regulated in rde-1 mutants with a P-value of <0.05; two-tailed t-test) in N2 animals upon infection, relative to the behavior of all genes. The density plot uses the mean from all biological replicates. (C) The change in small RNA reads normalized to total library size mapping antisense to either all protein-coding genes or protein-coding genes with RDE-1-dependent small RNAs mapping to them upon infection of N2 animals. Boxes show median and interquartile range, and the whiskers extend to the most extreme data point, which is no more than 1.5 times the interquartile range from the box. Dots represent outliers. (D) The gene expression changes for the same set of genes shown in C upon infection of N2 animals compared with the change in expression between uninfected N2 and uninfected rde-1 animals. (Red) Genes that were up-regulated by >30% (P < 0.05) in rde-1 mutant animals.


