
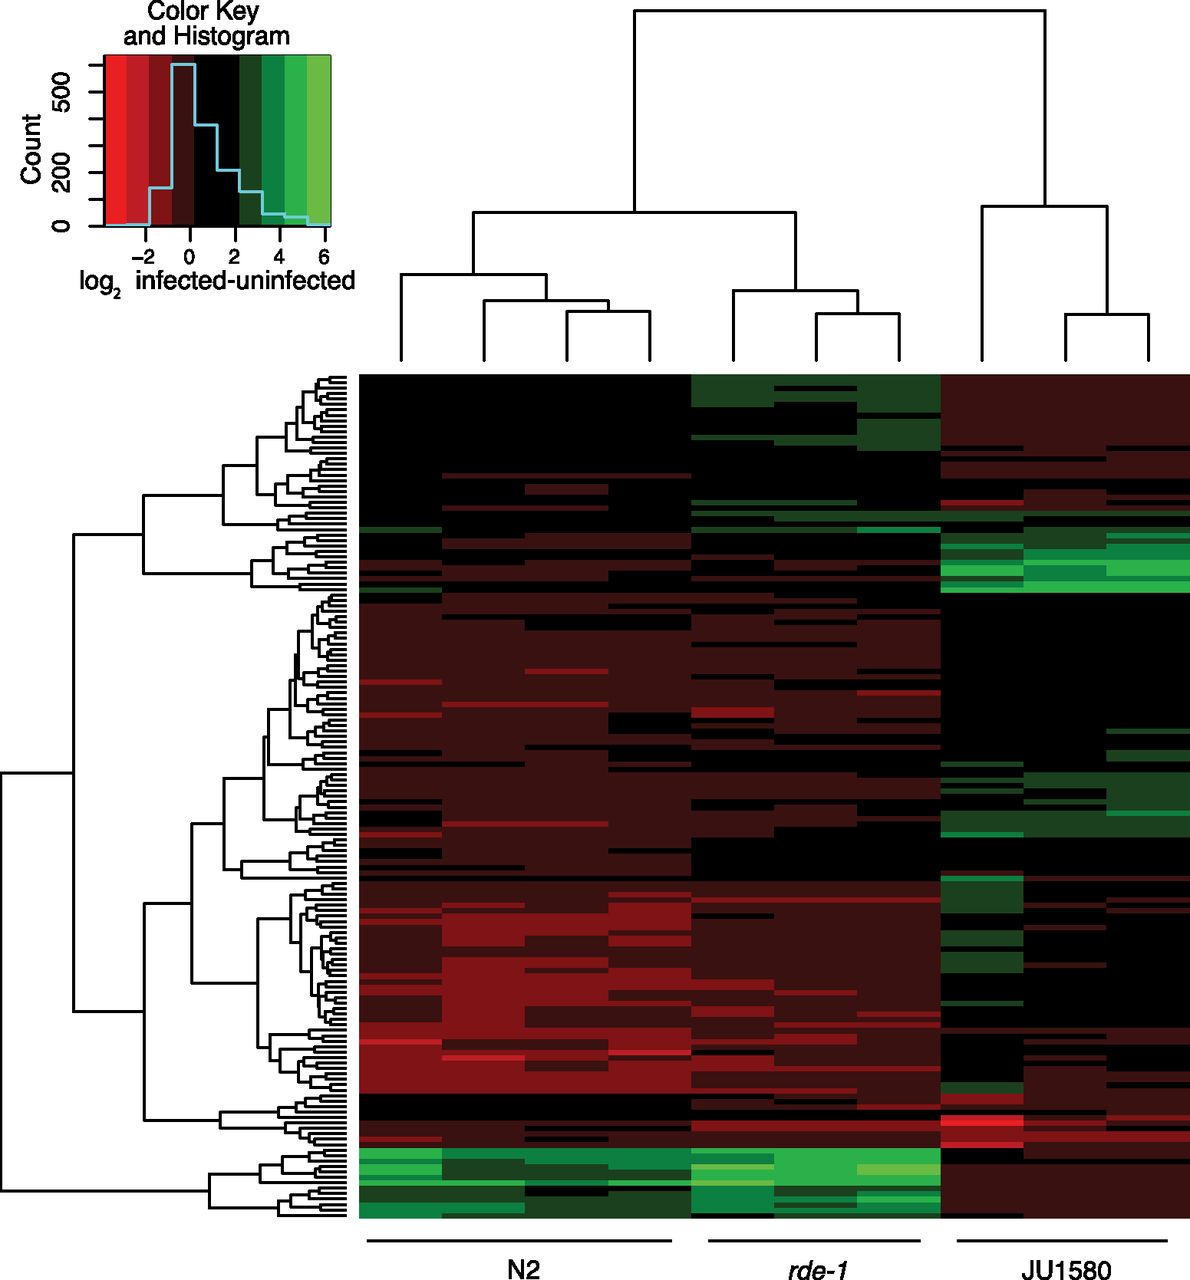
Figure 1.
Heatmap showing changes in gene expression upon viral infection. The heatmap shows all the genes that change by more than twofold in at least one strain after infection (t-test, P < 0.05). The changes that occur in each infected biological replicate (vertical lanes) relative to the mean value of all biological replicates of that strain without infection are indicated by the color on the red–green scale.


