
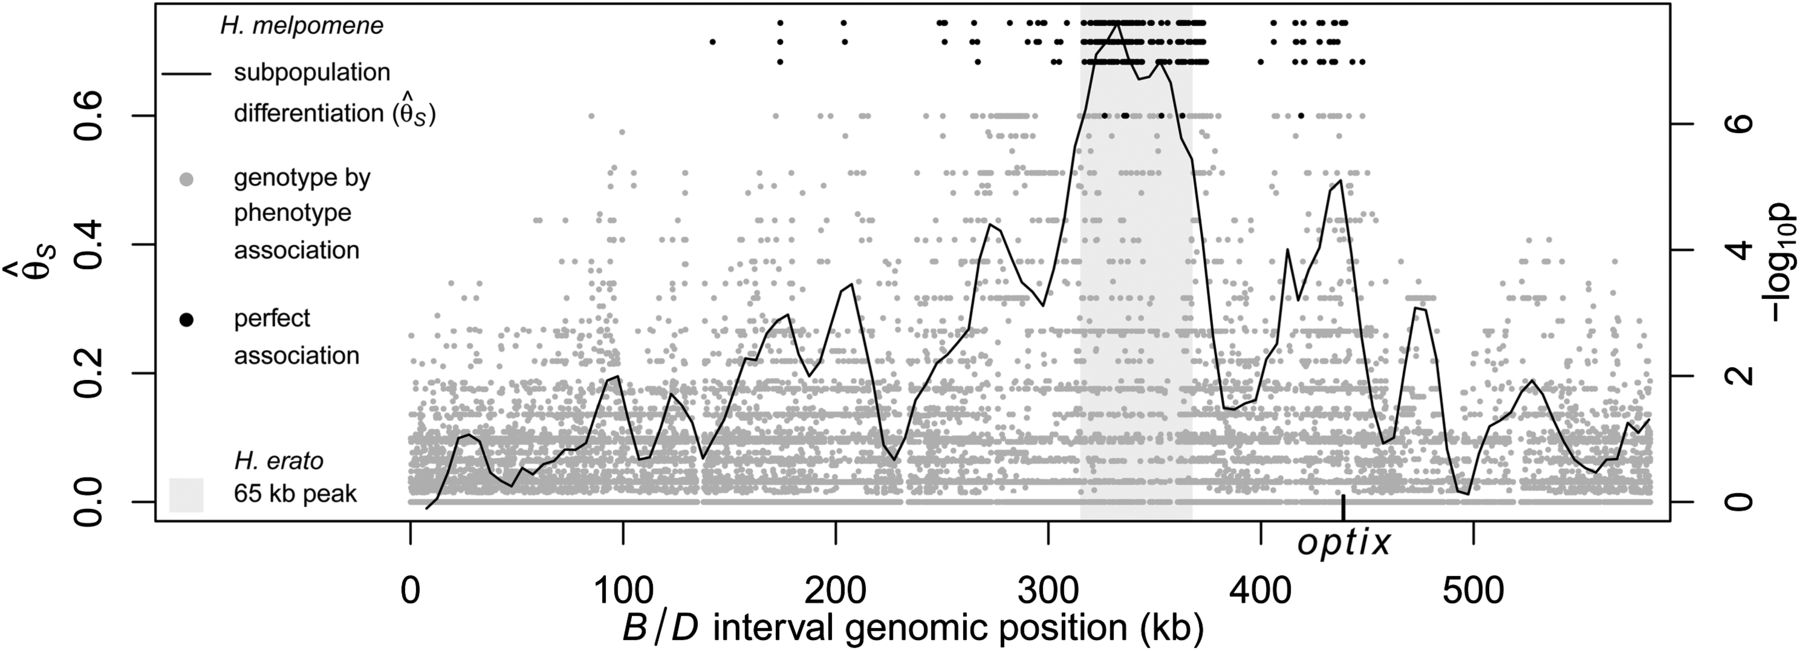
Divergence and association between divergent H. melpomene color pattern races across the B/D interval. The gray shaded area indicates the region of peak divergence and association identified in the co-mimic H. erato (Fig. 2). The solid line indicates sliding window (15-kb window size, 5-kb step size) subpopulation differentiation ( ) between the H. melpomene postman and rayed phenotypes for individuals from two hybrid zones (Peru, Colombia; npostman = 7; nrayed = 7), requiring a minimum of 75% of individuals genotyped for each phenotype at each position and data for at least 20% of
positions in the window. A baseline subpopulation differentiation of
) between the H. melpomene postman and rayed phenotypes for individuals from two hybrid zones (Peru, Colombia; npostman = 7; nrayed = 7), requiring a minimum of 75% of individuals genotyped for each phenotype at each position and data for at least 20% of
positions in the window. A baseline subpopulation differentiation of  = −0.03 was calculated from genomic scaffolds unlinked to color pattern. The dots indicate genotype by phenotype association
calculated for biallelic SNPs using a Fisher's exact test for both hybrid zones (npostman = 7; nrayed = 7), requiring a minimum of 75% of individuals genotyped for each phenotype at each SNP. The black dots indicate association
for the 430 SNPs perfectly associated with phenotype.
= −0.03 was calculated from genomic scaffolds unlinked to color pattern. The dots indicate genotype by phenotype association
calculated for biallelic SNPs using a Fisher's exact test for both hybrid zones (npostman = 7; nrayed = 7), requiring a minimum of 75% of individuals genotyped for each phenotype at each SNP. The black dots indicate association
for the 430 SNPs perfectly associated with phenotype.


