
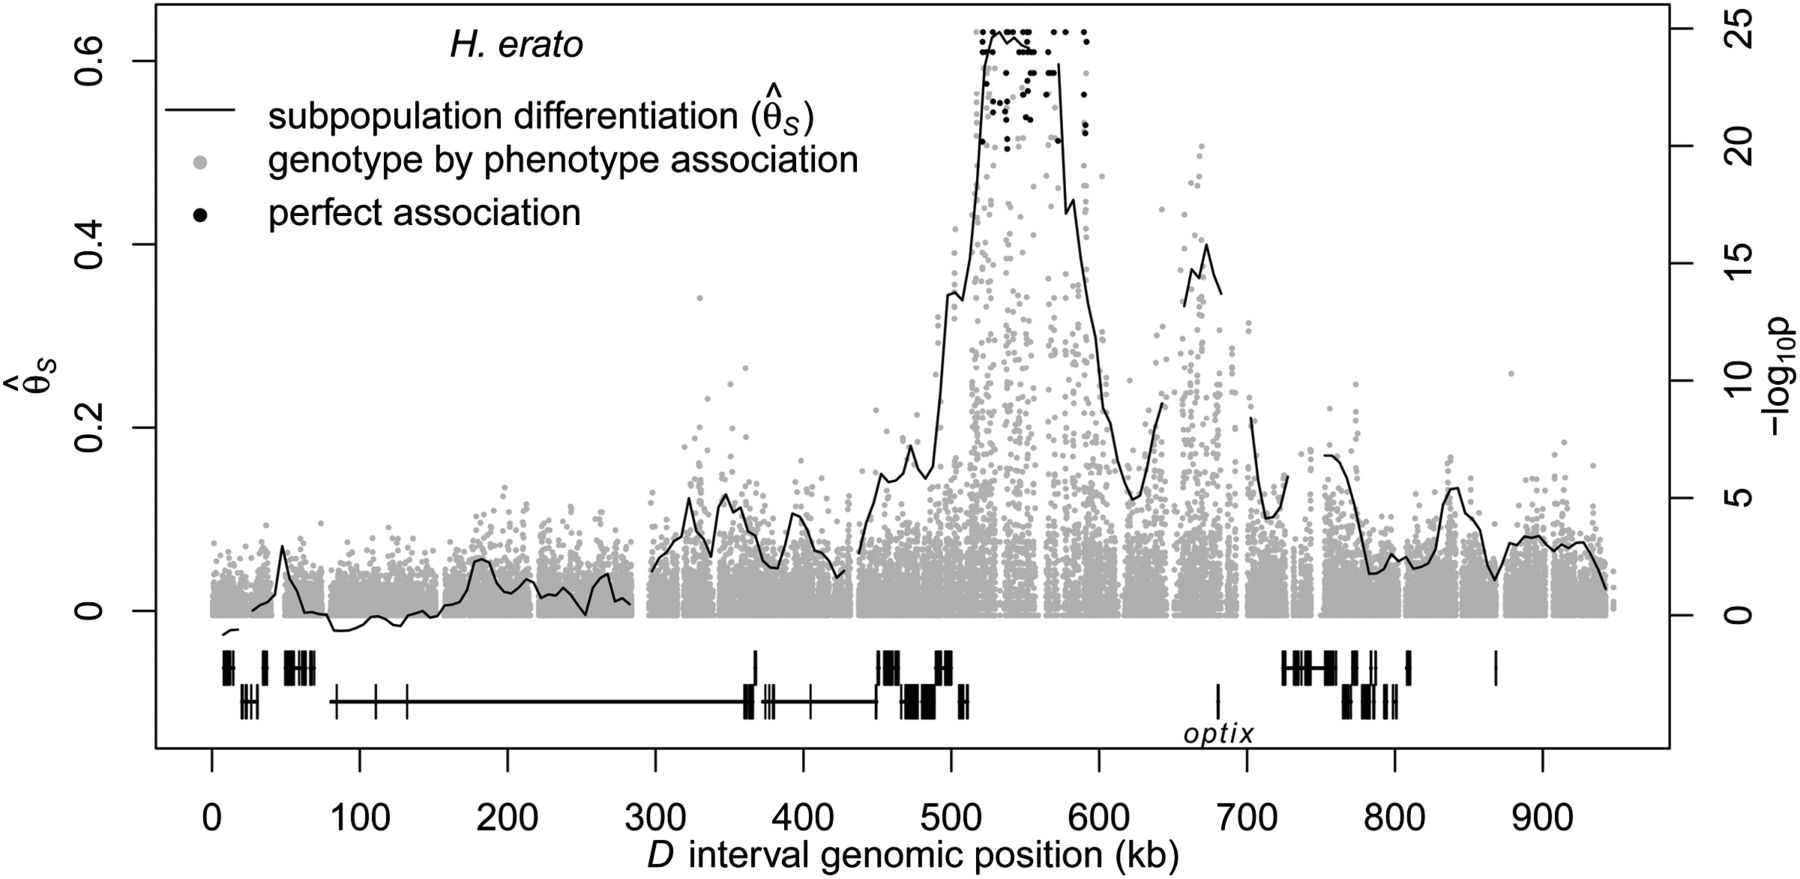
Divergence and association between divergent H. erato color pattern races across the D interval. The solid line indicates sliding window (15-kb window size, 5-kb step size) subpopulation differentiation ( ) between the H. erato postman and rayed phenotypes for individuals from three hybrid zones (Peru, Ecuador, French Guiana; npostman = 20; nrayed = 17), requiring a minimum of 75% of individuals genotyped for each phenotype at each position and data for at least 20%
of positions in each window. A baseline subpopulation differentiation of
) between the H. erato postman and rayed phenotypes for individuals from three hybrid zones (Peru, Ecuador, French Guiana; npostman = 20; nrayed = 17), requiring a minimum of 75% of individuals genotyped for each phenotype at each position and data for at least 20%
of positions in each window. A baseline subpopulation differentiation of  = −0.07 was calculated from genomic intervals unlinked to color pattern. The dots indicate genotype by phenotype association
calculated for biallelic SNPs using a Fisher's exact test for all four hybrid zones (npostman = 28; nrayed = 17), requiring a minimum of 75% of individuals genotyped for each phenotype at each SNP. The black dots indicate association
for the 76 SNPs perfectly associated with phenotype. The gene annotations are shown below for the plus strand (top) and minus strand (bottom), with the single exon gene optix denoted. Wider boxes represent coding exons and the narrower boxes represent introns.
= −0.07 was calculated from genomic intervals unlinked to color pattern. The dots indicate genotype by phenotype association
calculated for biallelic SNPs using a Fisher's exact test for all four hybrid zones (npostman = 28; nrayed = 17), requiring a minimum of 75% of individuals genotyped for each phenotype at each SNP. The black dots indicate association
for the 76 SNPs perfectly associated with phenotype. The gene annotations are shown below for the plus strand (top) and minus strand (bottom), with the single exon gene optix denoted. Wider boxes represent coding exons and the narrower boxes represent introns.


