
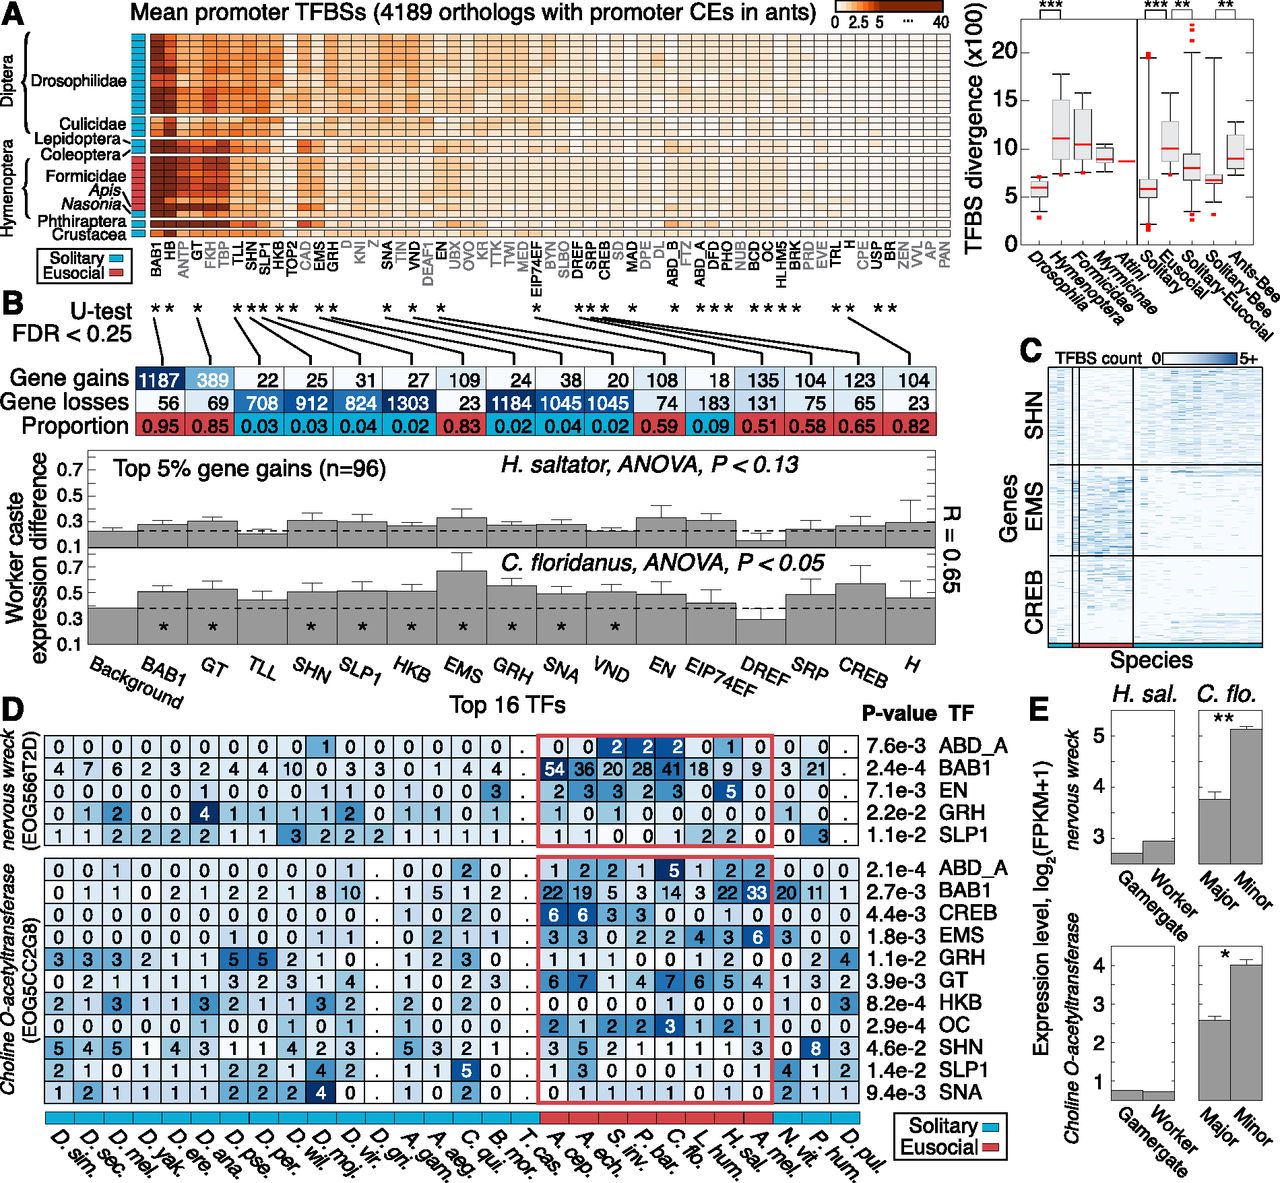
Evolution of transcription factor binding sites (TFBS) in insects. (A) Heatmap showing number of promoter TFBSs per gene for 59 TFs in 28 insect species (n = 4189 genes associated with 2-kb promoter CEs in ants). Species (rows), ordered by phylogenetic grouping, are denoted as solitary (blue) or eusocial (red). TFs were clustered hierarchically using average linkage by computing Euclidean distance between TFBS profiles over all queried genes. (Right) Boxplots show distributions of Euclidean distance values for pairs of species, computed using genome-wide TFBS abundance profiles over genes and TFs (see Supplemental Fig. 30). Each boxplot reflects a group of paired comparisons. P-values estimated by two-tailed Mann–Whitney U-test. (**) P < 10−5; (***) P < 10−10. (B) Genes and TFs exhibiting significant TFBS evolution between solitary and eusocial groups. Three thousand two hundred and thirty-one of 4189 genes had sufficient data for significance testing. (*)TF with significant promoter TFBS evolution (two-tail Mann–Whitney U-test; FDR < 0.25). Top two rows indicate numbers of genes showing significant gain or loss of binding sites for the specified TF. Bottom row indicates proportion of significant genes showing more TFBSs in eusocial compared with solitary insects. More than 93% of tested genes are single-copy in the ant genomes. Bottom panels show the mean and standard error of the standard deviation in RNA expression levels (y-axis) for 96 genes with greatest significance in multiple TFs (top 5%), grouped by TF. Expression levels estimated by log2(FPKM + 1). (FPKM) Fragments per kilobase per million reads. (*) Significantly increased caste variation in RNA expression (compared with all ant orthologs, Background, P < 0.05). (C) TFBS abundance profiles for significant genes, shown for three TFs. Species order (x-axis) as in A. (D) TFBS abundance profiles for two neuronal genes with significance in multiple TFs. Cell colors are row-normalized. Periods (.) Missing data. P-values were computed by a Mann–Whitney U-test. (E) mRNA expression level estimates for the genes in D, shown for different worker castes in H. saltator (reproductive/nonreproductive) and C. floridanus (major/minor). Error bars indicate standard error over three biological replicates. (**) FDR < 0.01; (*) FDR < 0.25.


