
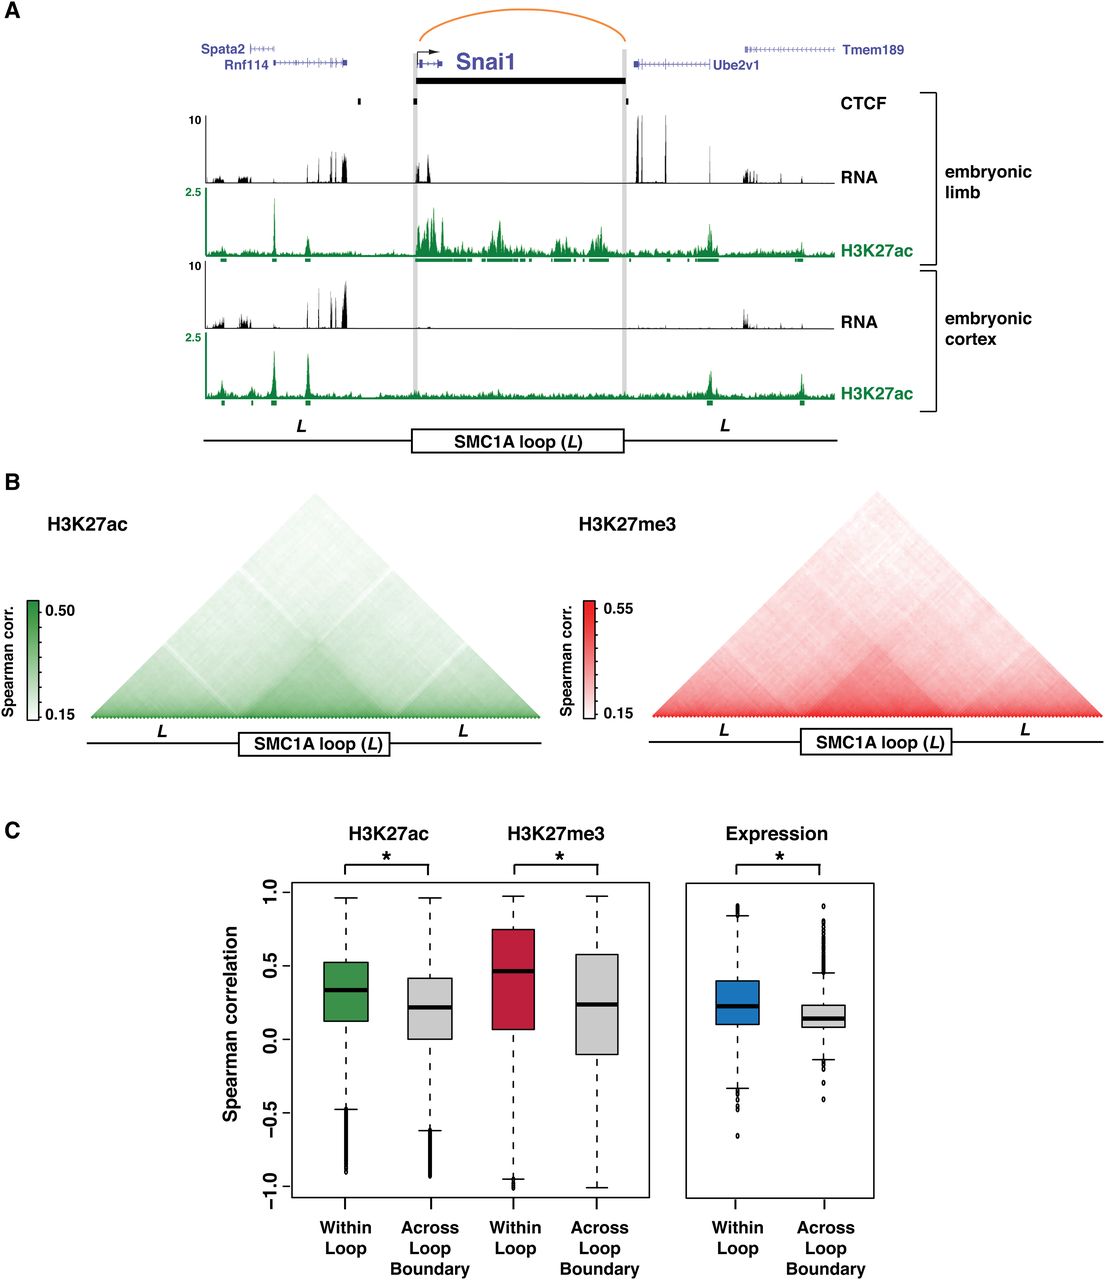
Cohesin interactions partition chromatin states and gene expression levels. (A) SMC1A ChIA-PET interaction at the Snai1 locus in E11.5 limb, with associated H3K27ac ChIP-seq and RNA-seq profiles in limb and E14.5 cortex (Ayoub et al. 2011). The upstream and downstream flanking regions are also shown (+/− one loop distance, L). (B, left) Mean pairwise Spearman correlations of H3K27ac signal across 19 cell types (Shen et al. 2012) using sites binned across all SMC1A interactions, spanning from one loop distance upstream (L) to one loop distance downstream (L). (Right) Mean pairwise Spearman correlations of H3K27me3 signal across six cell types (The ENCODE Project Consortium 2011) across all SMC1A interactions. (C, left) Distribution of pairwise Spearman correlations of H3K27ac and H3K27me3 signal within SMC1A interactions (within loop) or other pairings in the 3L interval (across loop boundary) ([*] Wilcoxon P-value < 2 × 10⁻¹⁶). (Right) Distribution of pairwise Spearman correlations of gene expression for SMC1A interactions containing two or more genes (within loop) compared to other pairings in the 3L interval (across loop boundary) ([*] Wilcoxon P-value < 2 × 10⁻¹⁶).


