
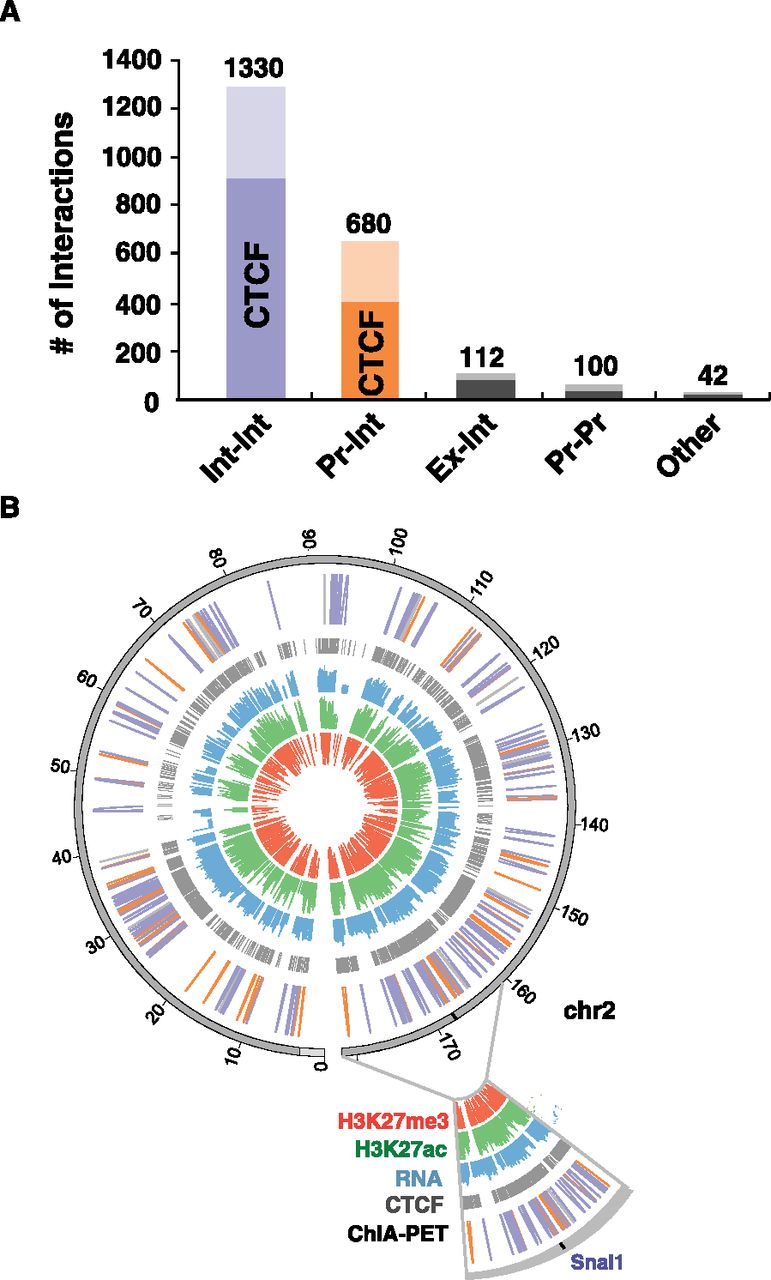
Cohesin interactions in the genome. (A) Classification of SMC1A ChIA-PET interactions, partitioned by CTCF co-occupancy. (Int) Intergenic or intronic sites; (Pr) promoter; (Ex) exonic. (B) Circos map of ChIA-PET interactions on chromosome 2. The outermost to innermost tracks are chromosome 2 (dark gray; centromere location indicated in light gray), ChIA-PET interactions (Int–Int interactions shown in blue, Pr–Int interactions in orange, and all others in gray), CTCF peaks (gray), z-scores of log2 transformed RPKM values of RNA-seq (blue), H3K27ac (green), and H3K27me3 (red). An expanded view of a 20-Mb region on chromosome 2 is shown with the location of the Snai1 locus (Fig. 3A).


