
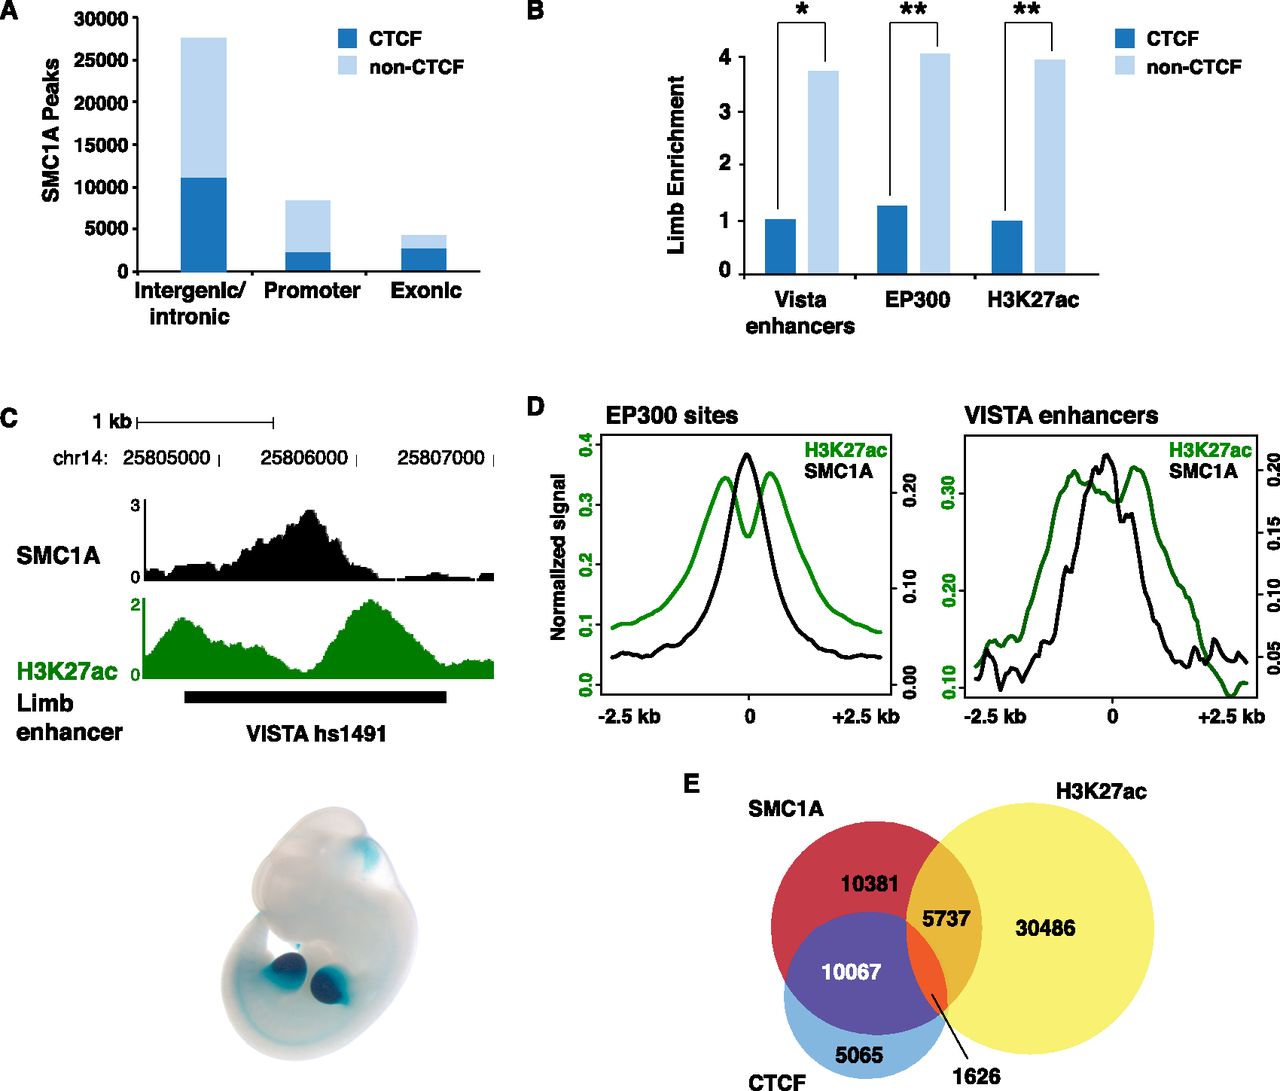
Cohesin binding in embryonic E11.5 limb bud. (A) Classification of SMC1A ChIP-seq peaks, partitioned by CTCF co-occupancy. (B) Intergenic and intronic SMC1A sites lacking CTCF (light blue bars) are enriched for limb enhancers in the VISTA Enhancer Browser (Visel et al. 2007) ([*] Fisher exact test P-value = 0.001) and putative enhancer marks, including the coactivator EP300 (Visel et al. 2009) and E11.5 limb-specific H3K27ac marking (Cotney et al. 2012) ([**] Fisher exact test P-value < 2 × 10⁻¹⁶), compared to sites co-occupied by CTCF (dark blue bars). (C) SMC1A and H3K27ac ChIP-seq signal profiles at a known limb enhancer, VISTA hs1491 (Visel et al. 2007). (D) SMC1A (black) and H3K27ac (green) normalized ChIP-seq signal aggregated at intergenic or intronic limb EP300 sites (left; n = 3613) (Visel et al. 2009) and known VISTA limb enhancers (right; n = 165) (Visel et al. 2007). (E) Overlap of intergenic and intronic sites occupied by SMC1A, CTCF, and H3K27ac.


