
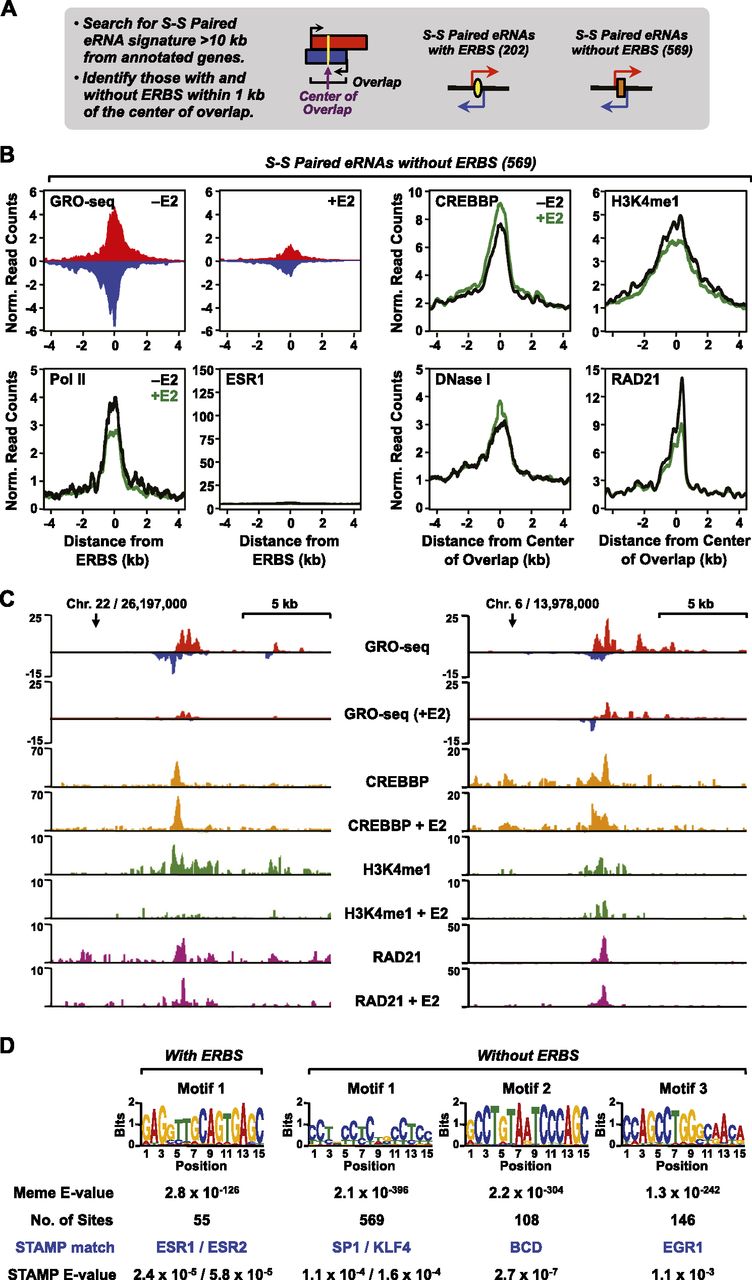
Unbiased search for ESR1 and non-ESR1 enhancers in MCF-7 cells using GRO-seq data. (A) Schematic of the unbiased enhancer search using GRO-seq data. All intergenic (>10 kb away from the start or end of an annotated RefSeq gene) short–short paired eRNAs <9 kb and with an average overlap of 3 kb were identified in the set of called transcripts from MCF-7 cells. (B) GRO-seq data, Pol II, ESR1, CREBBP, H3K4me1, and RAD21 ChIP-seq data, and DNase-seq data (as indicated) from the analysis described in panel A were collected, mapped relative to the center of the plus and minus strand overlap of the short–short paired eRNAs, and expressed as metaplots. (C) Browser tracks of GRO-seq and selected ChIP-seq data for two enhancers without ERBSs identified in the unbiased search described in panel A. (D) Web logos and statistical parameters for the top motifs identified in a search of enhancers identified in panel A. All occurrences of the short–short paired transcripts were collected and subjected to motif analysis. De novo motif searching was performed on a 1-kb region around the center of the plus and minus strand overlap (±500 bp) using MEME. The predicted motifs from MEME were matched to known motifs using STAMP.


