
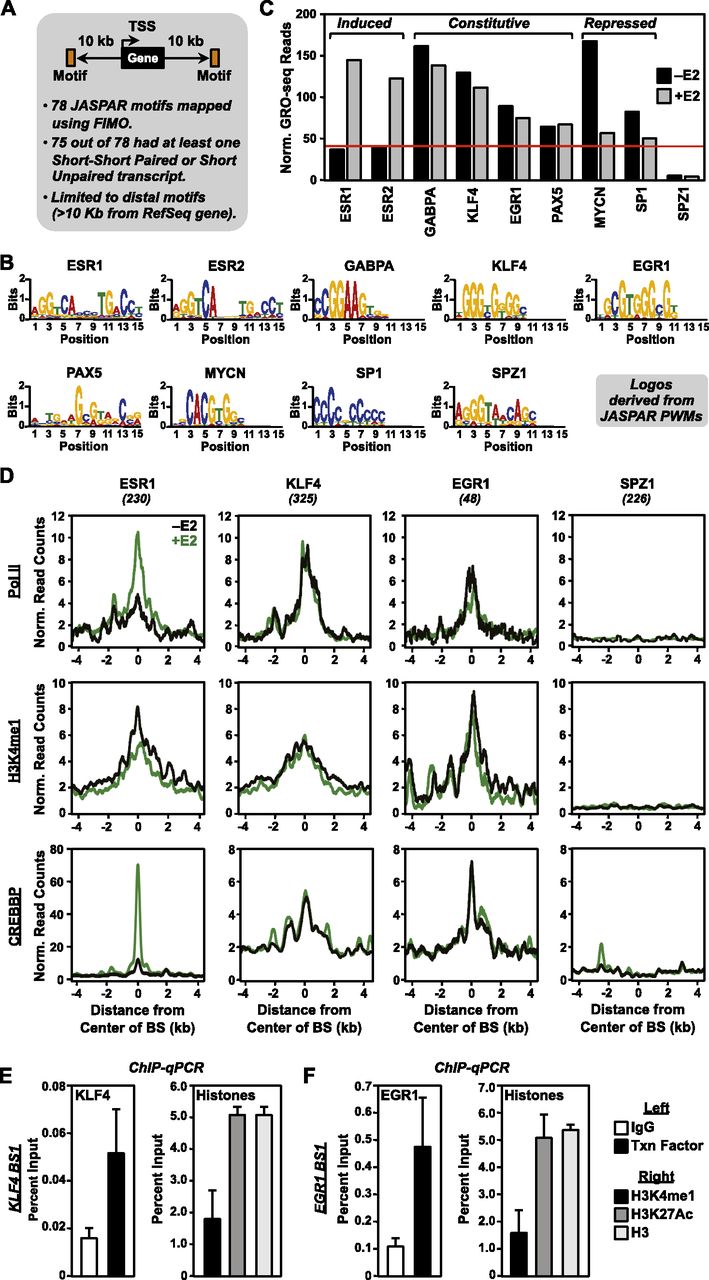
Directed search for ESR1 and non-ESR1 enhancers in MCF-7 cells using GRO-seq data. (A) Schematic of the directed enhancer search using GRO-seq data. Seventy-eight motifs from the JASPAR database were mapped to the human genome using FIMO. For all intergenic motifs (>10 kb from RefSeq genes) with eRNAs (either short–short paired or short unpaired) originating within a 2-kb window around the center of the motif (i.e., ±1 kb relative to the motif), we collected the GRO-seq reads within a 1-kb window around the center of the motif (i.e., ±0.5 kb relative to the motif) and normalized them to the total number of occurrences of the motif. (B) Bar graph showing the normalized GRO-seq read count density per occurrence for nine selected motifs from the JASPAR database ± E2. (C) Web logos for the nine selected motifs shown in panel B generated using the JASPAR position weight matrices (PWMs). (D) Metaplots of Pol II, H3K4me1, and CREBBP ChIP-seq data from MCF-7 cells treated with (green lines) or without (black lines) E2 for four selected motifs from panel B. (E,F) ChIP-qPCR assays of KLF4 (E) and EGR1 (F) binding (left panels) and enhancer-associated histone modifications (H3K4me1 and H3K27ac; right panels) at cognate predicted binding sites. Each bar represents the mean + SEM for three or more independent biological replicates.


