
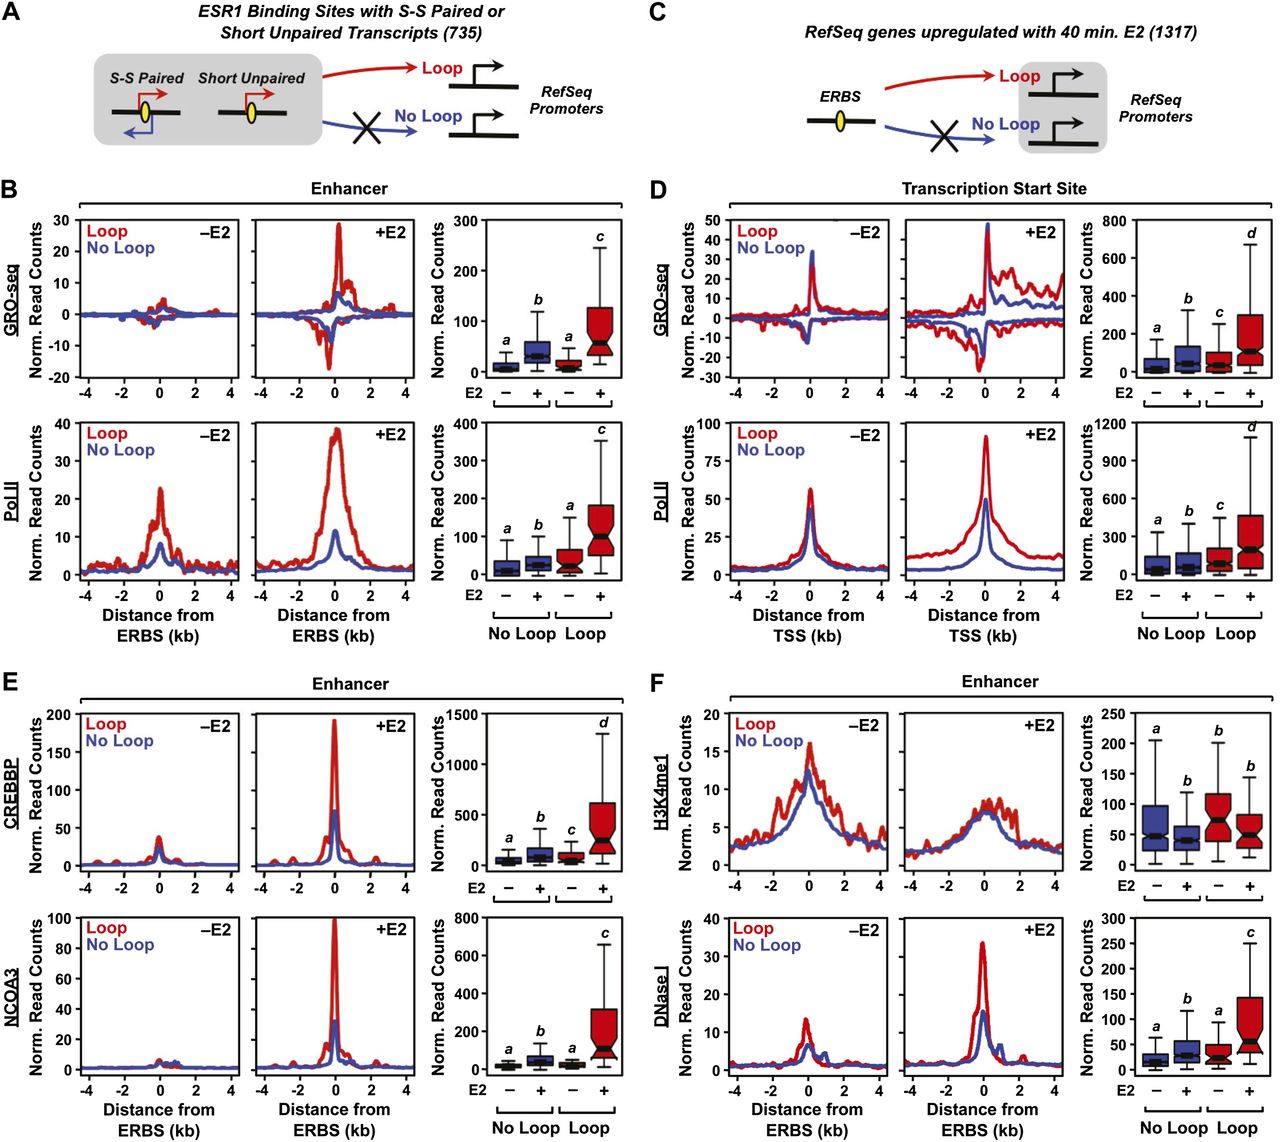
The production of eRNAs from ERBSs positively correlates with enhancer looping to target genes in MCF-7 cells. (A,C) Schematics of the looping analyses based on ESR1 ChIA-PET data. ERBSs (enhancers) were queried to determine if they loop to the promoters of RefSeq genes, based on ESR1 ChIA-PET data. Looping was assayed within a 2-kb (±1 kb) window around ESR1 peak centers and a 10-kb (±5 kb) window around the TSSs of target genes. (B) Metaplots and boxplots for GRO-seq (top) and Pol II ChIP-seq (bottom) data for ERBSs that either loop to (Loop, red lines) or do not loop to (No Loop, blue lines) target gene promoters. (D) Metaplots and boxplots for GRO-seq (top) and Pol II ChIP-seq (bottom) data for target gene promoters that are either looped to (Loop, red lines) or are not looped to (No Loop, blue lines) ERBSs. (E) Metaplots and boxplots for CREBBP ChIP-seq (top) and NCOA3 ChIP-seq (bottom) data for ERBSs that either loop to (Loop, red lines) or do not loop to (No Loop, blue lines) target gene promoters. (F) Metaplots and boxplots for H3K4me1 ChIP-seq ChIP-seq (top) and DNase-seq (bottom) data for ERBSs that either loop to (Loop, red lines) or do not loop to (No Loop, blue lines) target gene promoters.


