
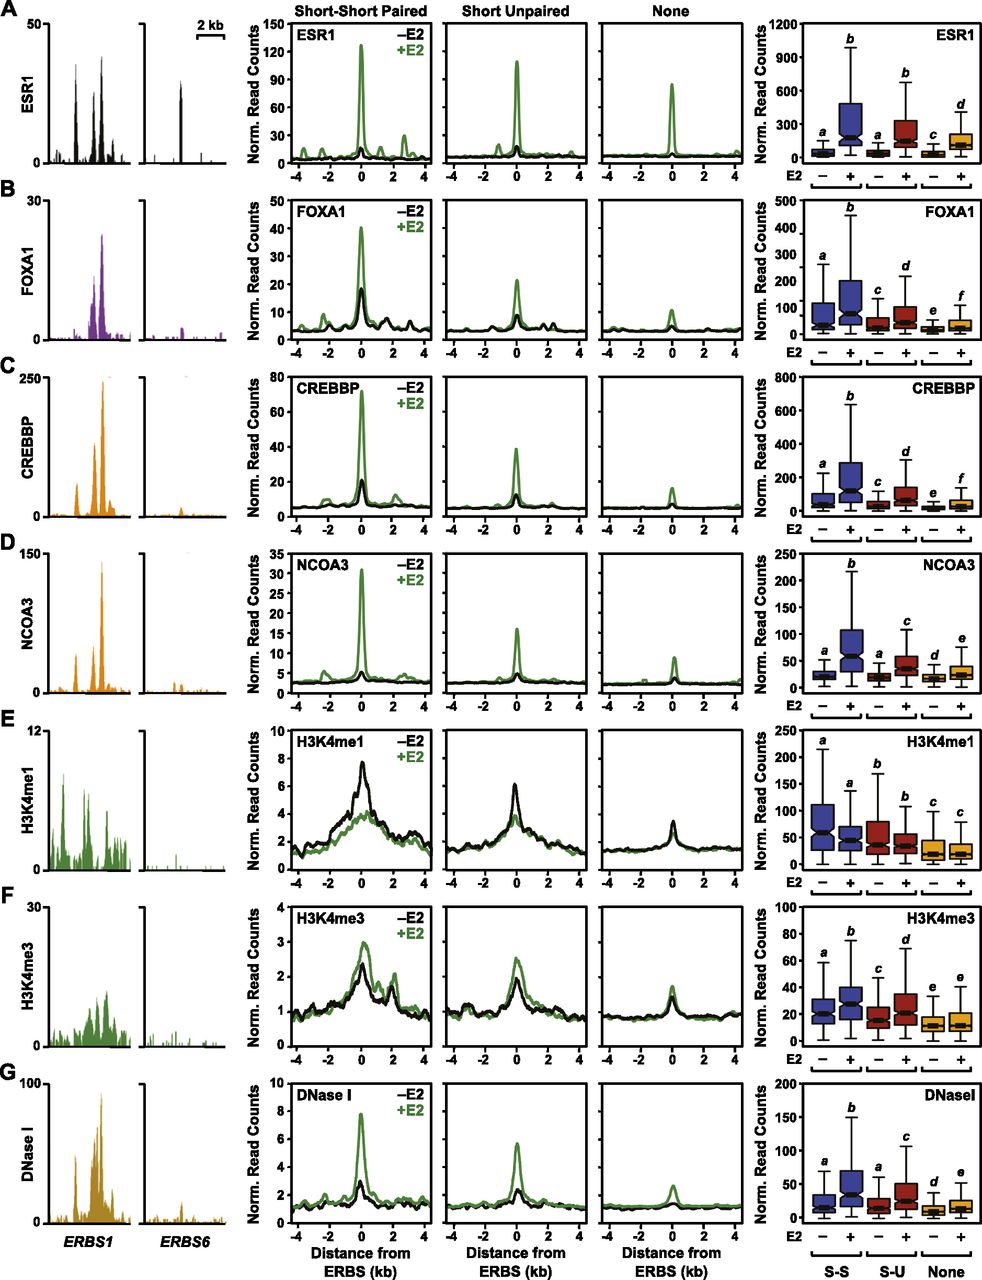
The production of eRNAs from ERBSs positively correlates with the recruitment of coactivators, the levels of histone modifications, and the chromatin state in MCF-7 cells. Browser tracks, metaplots, and boxplots showing a positive correlation between eRNA production at ERBS with known markers of enhancer function. (Left two panels) Browser track representations of coactivator or histone modification ChIP-seq data, or DNase-seq data, as indicated on the y-axis for ERBS1 and ERBS6. (Middle three panels) Metaplot analyses of ChIP-seq or DNase-seq read counts for sets of ERBSs with short–short paired, short unpaired, or no transcripts in the presence (green line) or absence (black line) of E2 treatment. (Right panel) Box plot representations of ChIP-seq or DNase-seq data for sets of ERBSs with short–short paired (blue boxes), short unpaired (maroon boxes), or no transcripts (orange boxes) in the presence (+) or absence (−) of E2 treatment. (A) ESR1 ChIP-seq. (B) FOXA1 ChIP-seq. (C) CREBBP ChIP-seq. (D) NCOA3 ChIP-seq. (E) H3K4me1 ChIP-seq. (F) H3K4me3 ChIP-seq. (G) DNase-seq.


