
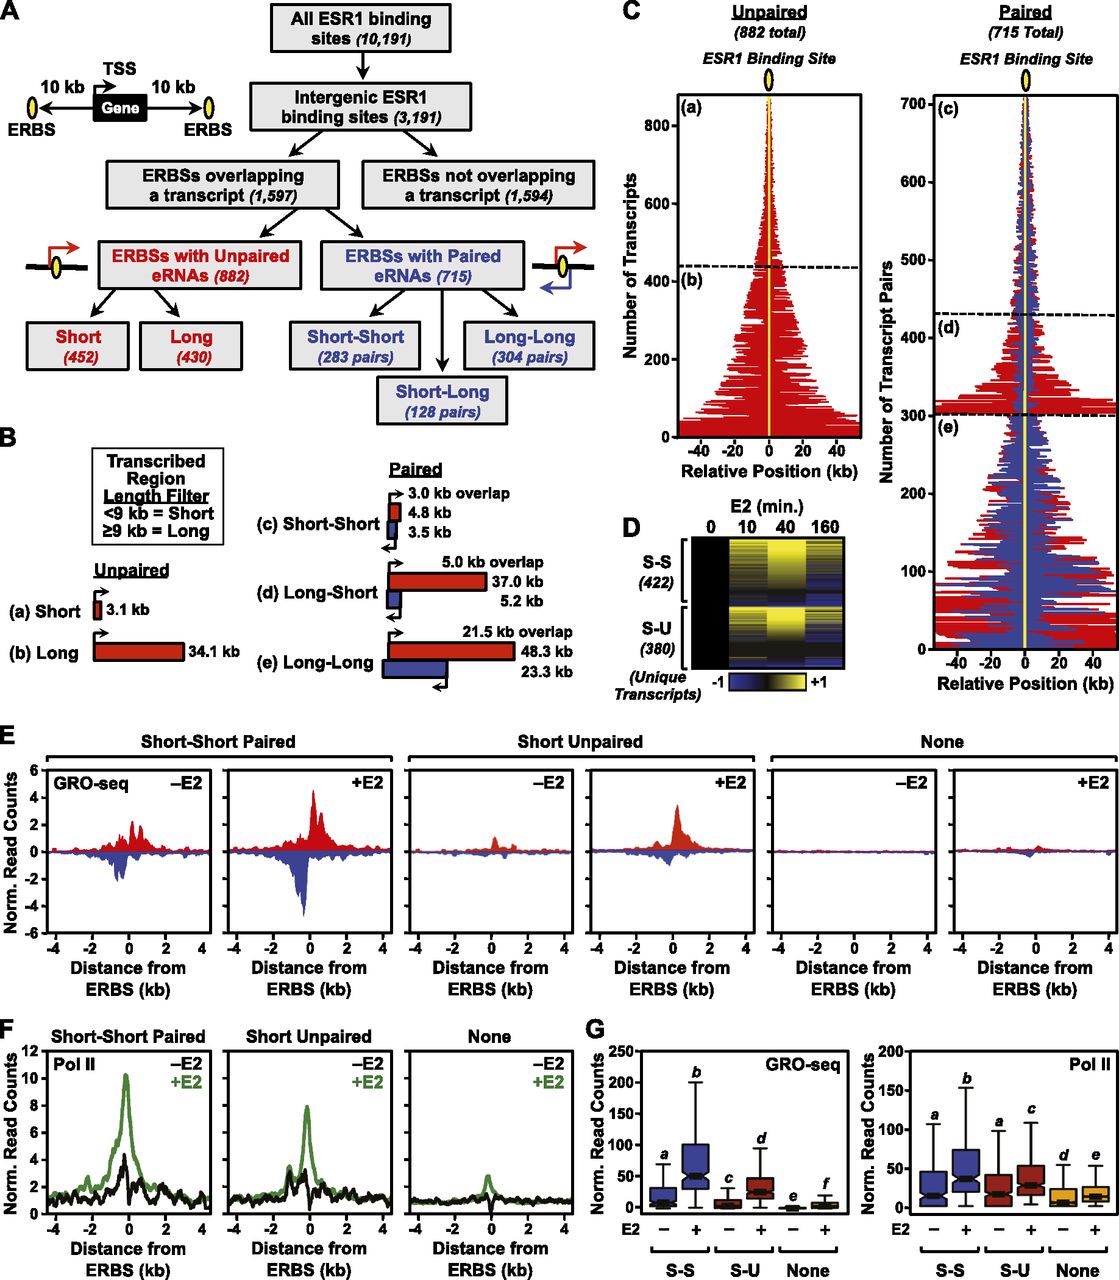
Genome-wide identification of ESR1 enhancer transcripts in MCF-7 cells using GRO-seq. (A) Flowchart of ERBS classification in MCF-7 cells based on genomic location, eRNA production, and length of the transcribed region based on ChIP-seq and GRO-seq. (B) Schematics of average transcribed regions overlapping ERBSs in MCF-7 cells in five classes: (a) short unpaired, (b) long unpaired, (c) short–short paired, (d) long–short paired, and (e) long–long paired. “Short” and “Long” indicate a transcribed region <9 kb or ≥9 kb, respectively. (Red and blue boxes) Transcription from opposite strands. (C) Graphical representation of the positions and orientations of eRNAs (indicated by red and blue lines) relative to ESR1 binding sites (indicated by yellow oval and line) for unpaired and paired eRNAs in MCF-7 cells. The position relative to the ERBS is indicated in kilobases. (a–e) Correspond to the categories shown in panel B. (Red and blue lines) Transcription from opposite strands. (D) Heat map showing the expression of E2-regulated short unpaired (S-U) and short–short paired (S-S) eRNAs over a time course of E2 treatment in MCF-7 cells based on GRO-seq data. The data were median centered and scaled to the 0-min time point. Yellow and blue indicate up-regulated and down-regulated transcripts, respectively. Only unique transcripts are shown (i.e., those transcripts that overlap more than one ERBS are represented once). (E) Metaplot analyses of GRO-seq reads surrounding ERBSs associated with short–short paired transcripts, short unpaired transcripts, or no transcripts in MCF-7 cells ± E2 treatment. (F) Metaplot analyses of Pol II ChIP-seq reads surrounding ERBSs associated with short–short paired transcripts, short unpaired transcripts, or no transcripts in MCF-7 cells ± E2 treatment. (G) Box plot representation of GRO-seq and Pol II ChIP-seq reads associated with short–short paired transcripts (S-S), short unpaired transcripts (S-U), or no transcripts in MCF-7 cells ± E2 treatment.


