
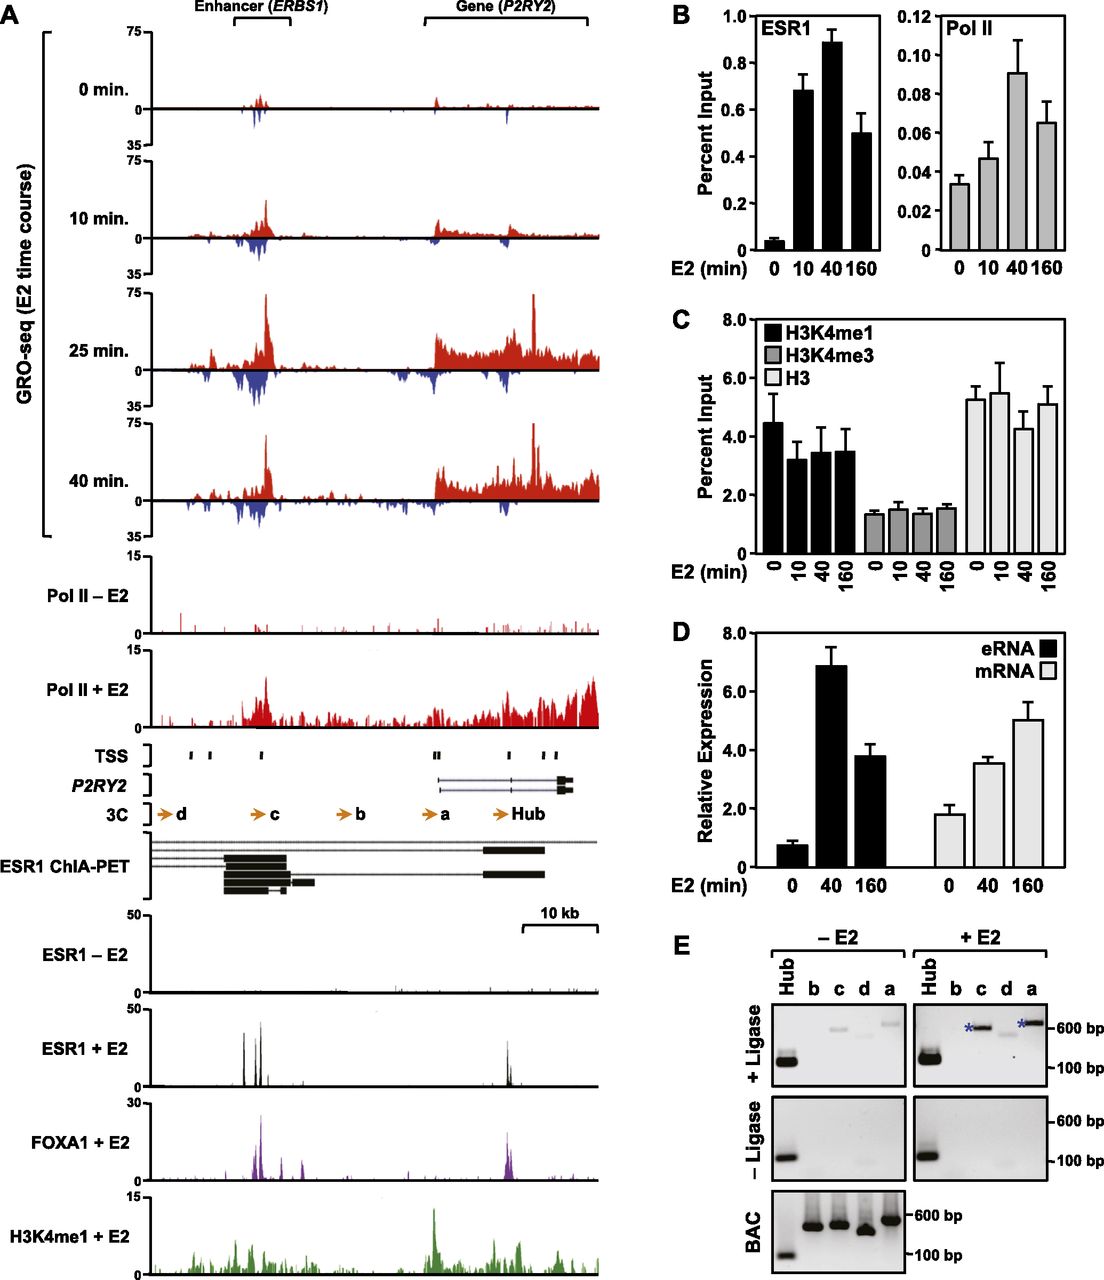
The ESR1 enhancer of the estrogen-responsive P2RY2 gene produces bidirectional transcripts in MCF-7 cells. (A) Browser tracks of GRO-seq, ChIP-seq (Pol II, ESR1, FOXA1, and H3K4me1), ChIA-PET, TSS locations, and gene annotation for P2RY2 and its distal ESR1 binding site (ERBS1). The data are from MCF-7 cells treated with a time course of E2 (GRO-seq) or a single time point of E2 (45 or 60 min). TSSs identified previously based on a published data set from MCF-7 cells (Yamashita et al. 2011) are located as indicated. (Orange arrows) The locations of primers used for 3C assays. The black bars shown for the ChIA-PET data indicate the “head” and “tail” making contact in the gene loops, which are indicated by the dotted black lines. Scale bars show the length of the indicated region. A more detailed set of genomic data for P2RY2, as well as data for additional enhancer/gene pairs, can be found in Supplemental Figures 1 and 2. (B,C) ChIP-qPCR analyses showing recruitment of ESR1 and Pol II (B) or levels of H3K4me1, me3, and H3 (C) at ERBS1 in response to a time course of E2 treatment. Each bar represents the mean + the SEM for three or more independent biological replicates. (D) RT-qPCR analyses showing the expression of ERBS1 eRNA and P2RY2 mRNA in response to a time course of E2 treatment. Each bar represents the mean + the SEM for three or more independent biological replicates. (E) 3C-PCR assay showing E2-induced looping between ERBS1 and the P2RY2 gene. The lowercase letters correspond to the primers denoted by orange arrows shown in panel A. The assays were conducted in the presence (experimental) or absence (control) of DNA ligase, as indicated. Digested and ligated bacterial artificial chromosome (BAC) DNA spanning the entire P2YR2 locus was used as a PCR control. The size of the PCR fragments in base pairs is shown. One representative experiment from three conducted is shown.


