
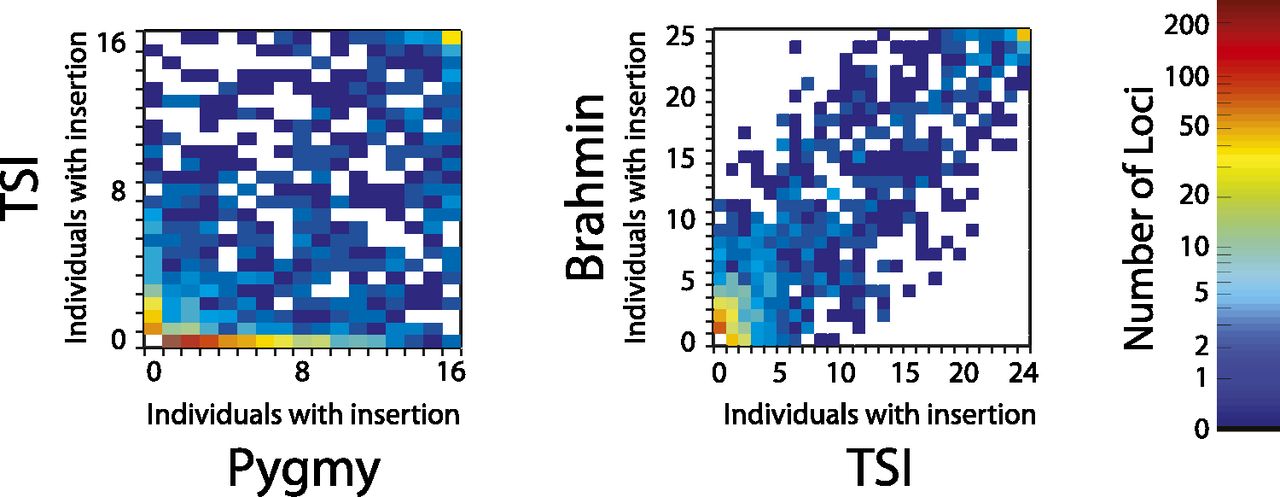
Heat maps comparing counts of Alu insertions present in 24 TSI vs. 17 Pygmy individuals (left panel; Pearson correlation coefficient 0.63, 1591 variable loci) and Brahmin vs. TSI (right; correlation coefficient 0.91, 1063 variable loci). The numbers of individuals in which an insertion could be observed (from zero to the total number of individuals in the sample) are represented on the horizontal (x) and vertical (y) axes. The numbers of Alu insertion loci observed in (x, y) individuals in the pair of populations are represented as colors according to the legend bar (log scale). Only loci that were novel or previously observed as polymorphic were considered. An insertion at a locus was counted as present in an individual if at least 10 coverage-corrected reads were observed from that individual.


