
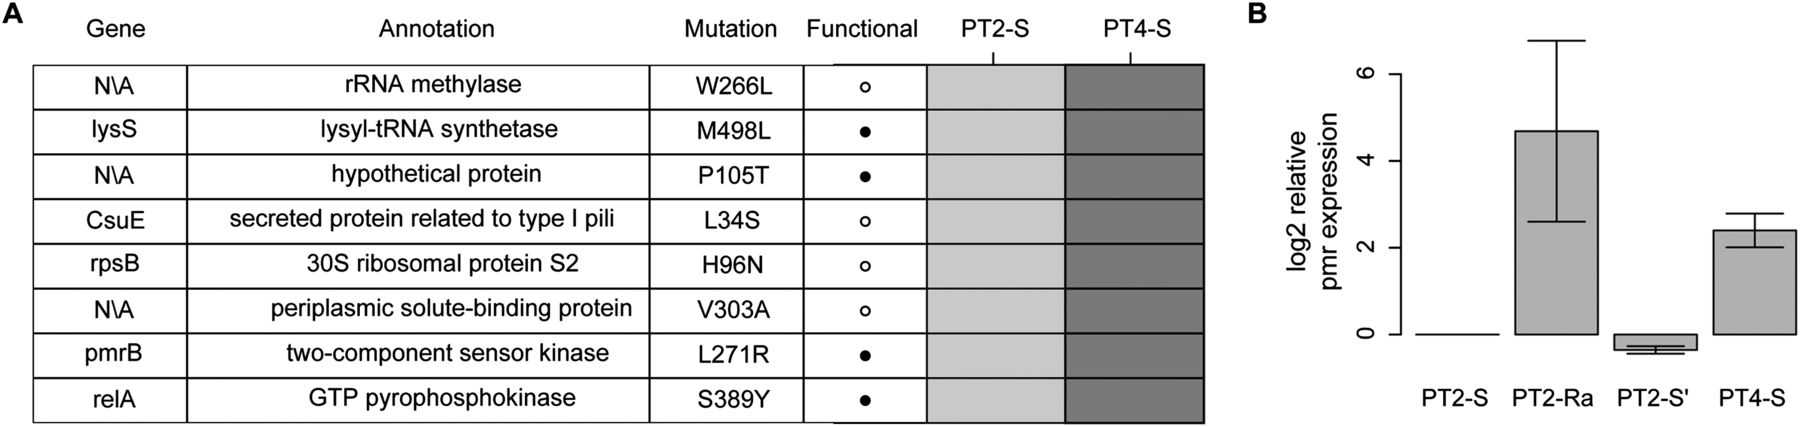
Figure 4.
Initial isolate from patient 4 has elevated pmr expression. (A) Rows in the table represent all nonsynonymous mutations in nonrecombinant regions identified between the initial isolates of patients 2 (PT2-S) and 4 (PT4-S). Dark/light gray boxes in the heatmap represent the presence/absence of mutations in patient isolates. The pmr gene mutation is bolded to emphasize its hypothesized role in colistin resistance of PT4-S. (B) The expression of the pmr transcript relative to PT2-S is shown for PT2-R, PT2-S′, and PT4-S. The expression values are the mean and standard error for three replicates


