
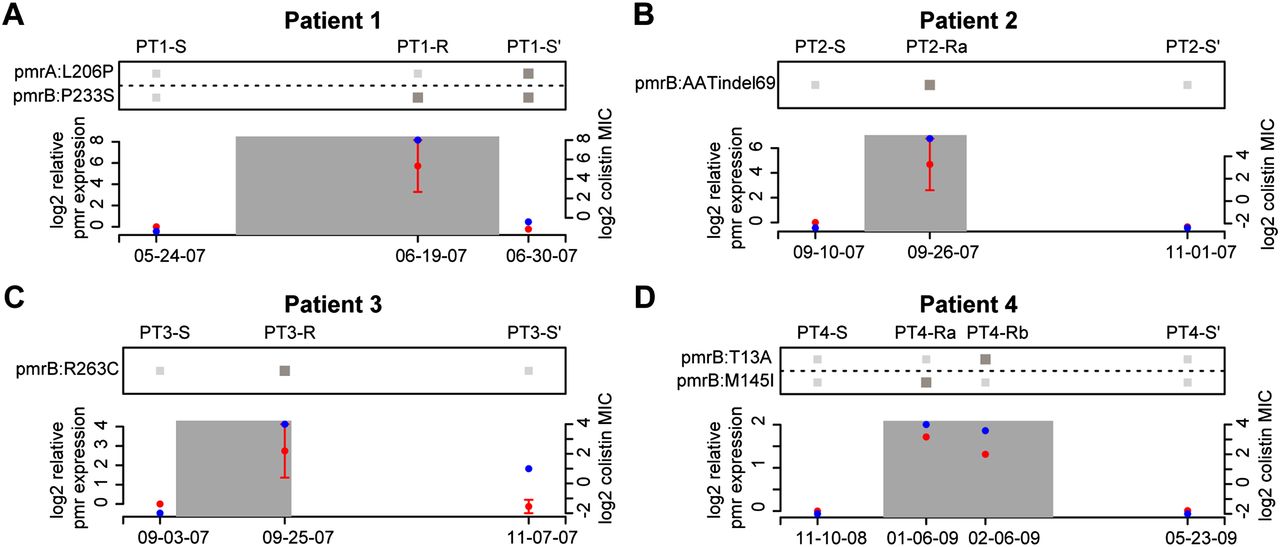
Mutations at pmr locus account for altered pmr expression and colistin MICs. (A–D) The relationship between pmr genotype, pmr transcript level, and colistin MICs is shown for patients 1 through 4. The x-axis of each plot represents time, with the date of each isolate labeled. The left y-axis of each plot represents the pmr expression relative to the initial patient isolate and corresponds to red points. The expression values and error bars are based on the mean and standard error of three replicate experiments. The right y-axis of each plot represents the isolates MICs and corresponds to blue points. The heatmap above represents the presence/absence (dark/light gray) of mutations to the pmr observed in each patient's isolates.


