
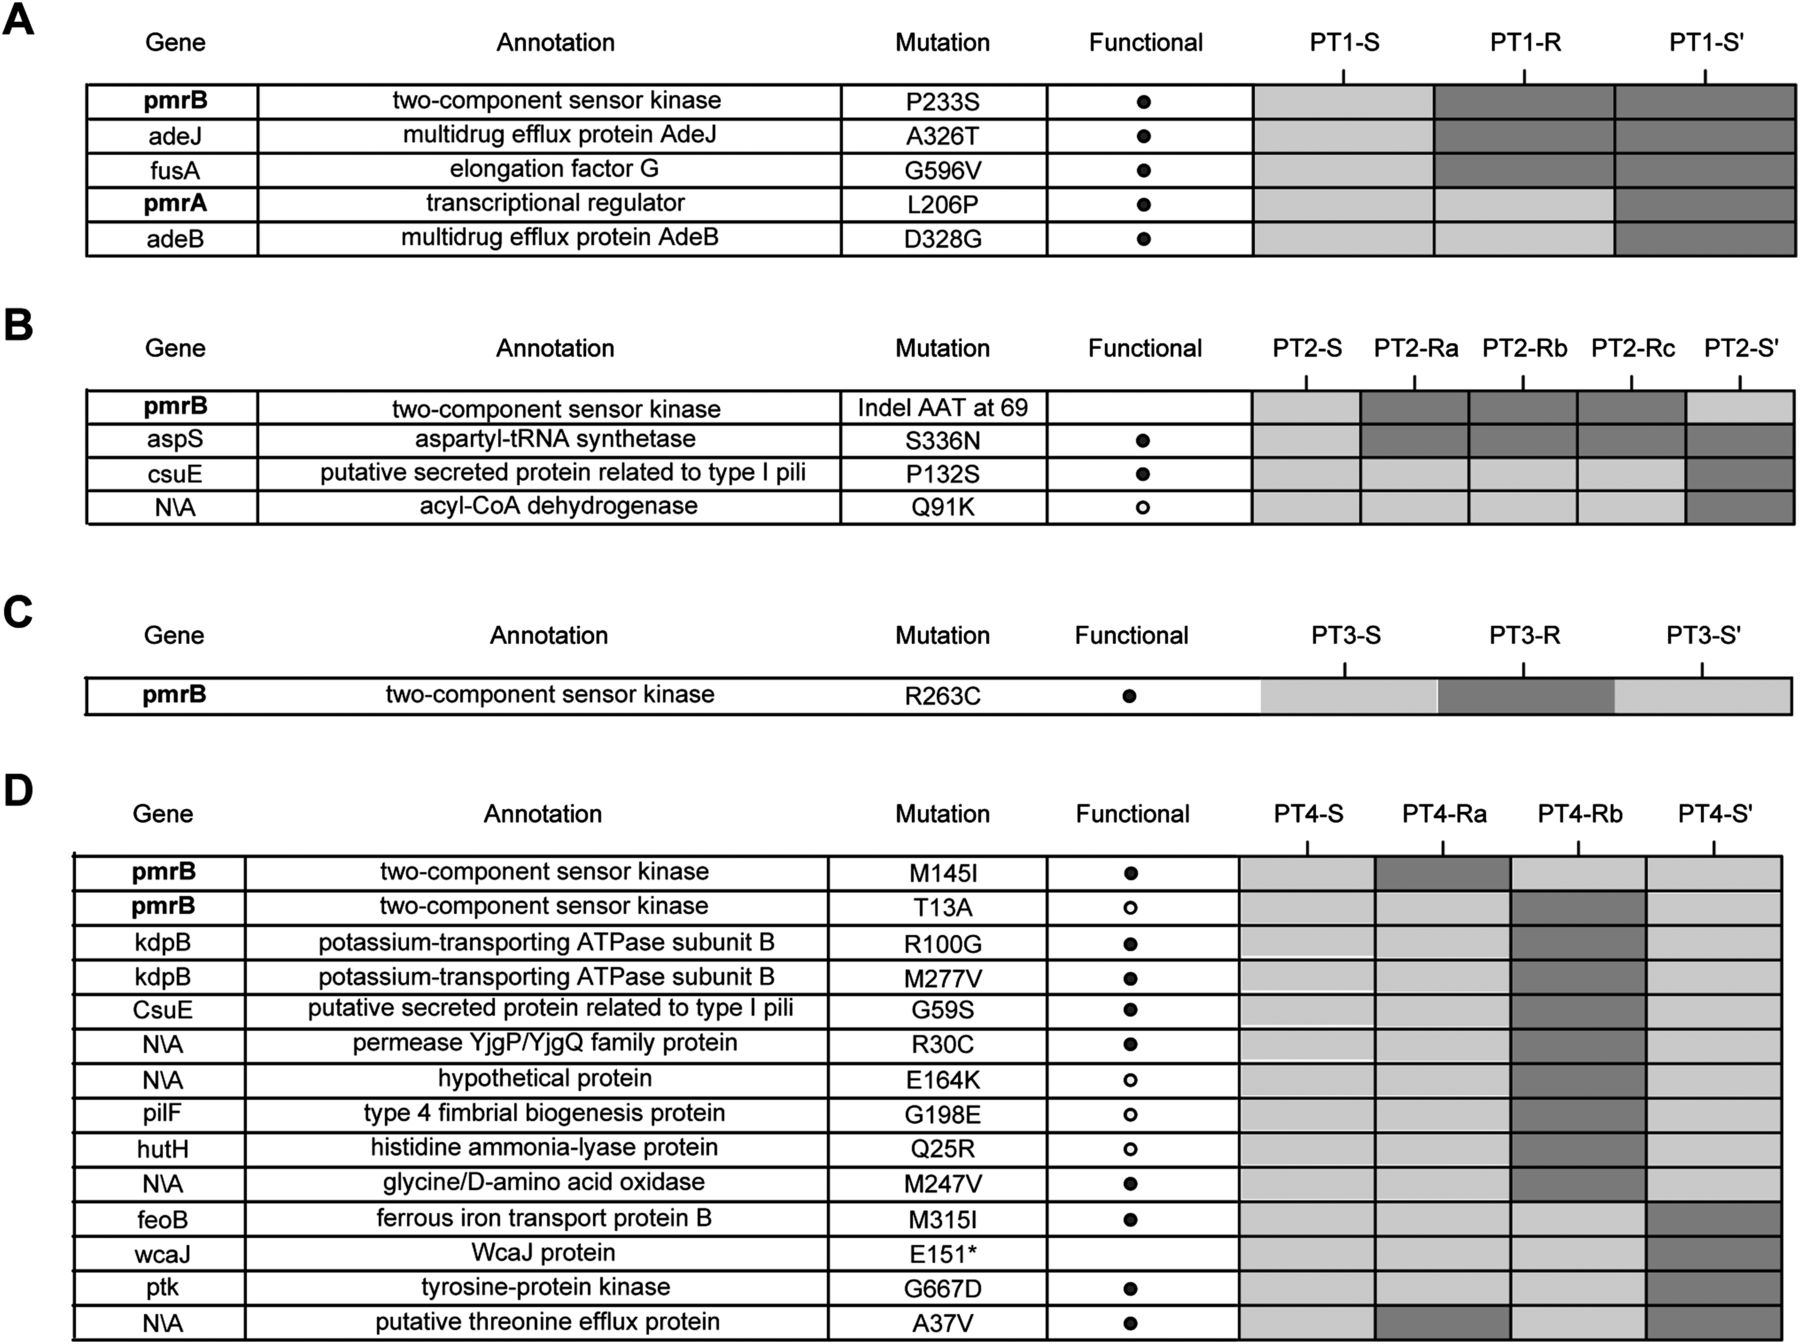
Genome-wide single-nucleotide variants in longitudinal patient isolates. (A–D) Rows in each table represent all nonsynonymous mutations identified across the genomes of isolates derived from patients 1 through 4. Isolates from each patient are shown in temporal order, in the columns of the corresponding patient's heatmap. Dark/light gray boxes in the heatmap represent the presence/absence of mutations in patient isolates. The pmr genes appear in boldface, to emphasize their mutation in the resistant isolates from each patient. The putative functional impact of mutations was predicted using SIFT. Note that for PT3-S′ unique mutations are not shown, as this is a different strain type from PT3-S and PT3-R and, therefore, has several hundred unique variants.


