
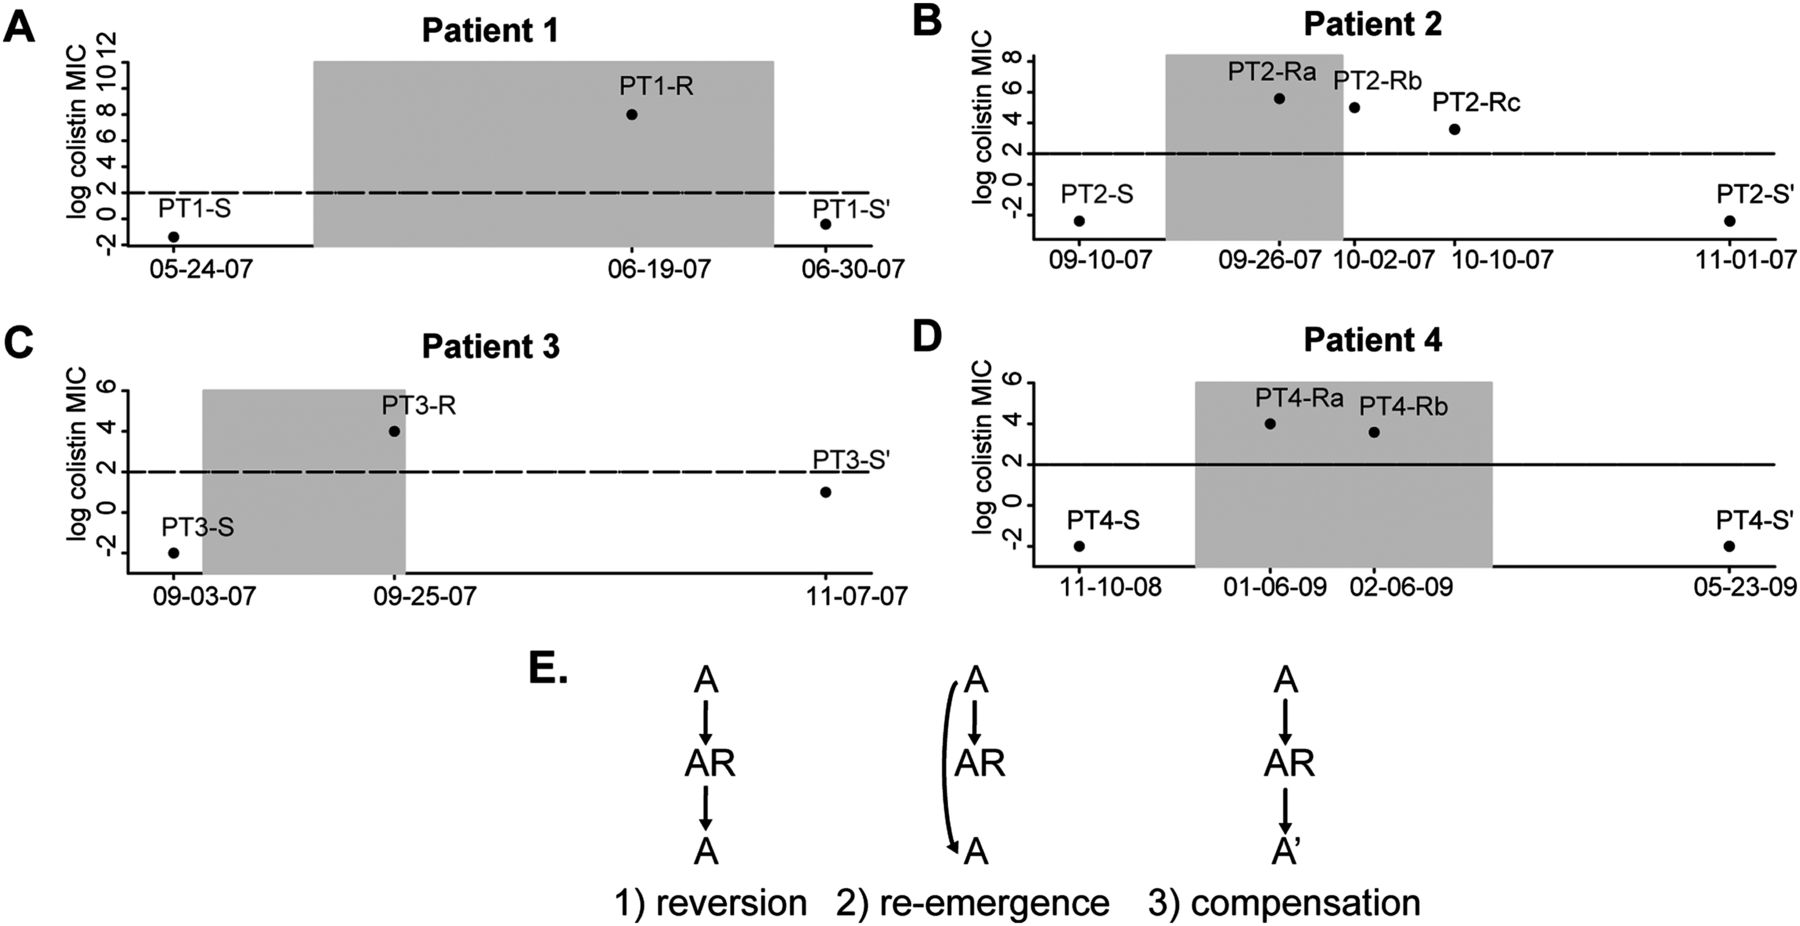
Gain and loss of colistin resistance in A. baumannii. (A–D) The colistin minimal inhibitory concentrations (MICs) of A. baumannii isolates from the four study patients are shown. The x-axis represents time, with the shaded box indicating the time period during which the patient received colistin. The y-axis shows the colistin MICs, with the horizontal line drawn at an MIC value of 4, which is the clinical cutoff for colistin resistance. Patients' isolates include their initial susceptible isolate (S), at least one resistant isolate (R), and a post-colistin susceptible isolate (S′). (E) Models illustrating the potential evolutionary paths underlying the loss of colistin resistance in patients 1 through 4.


