
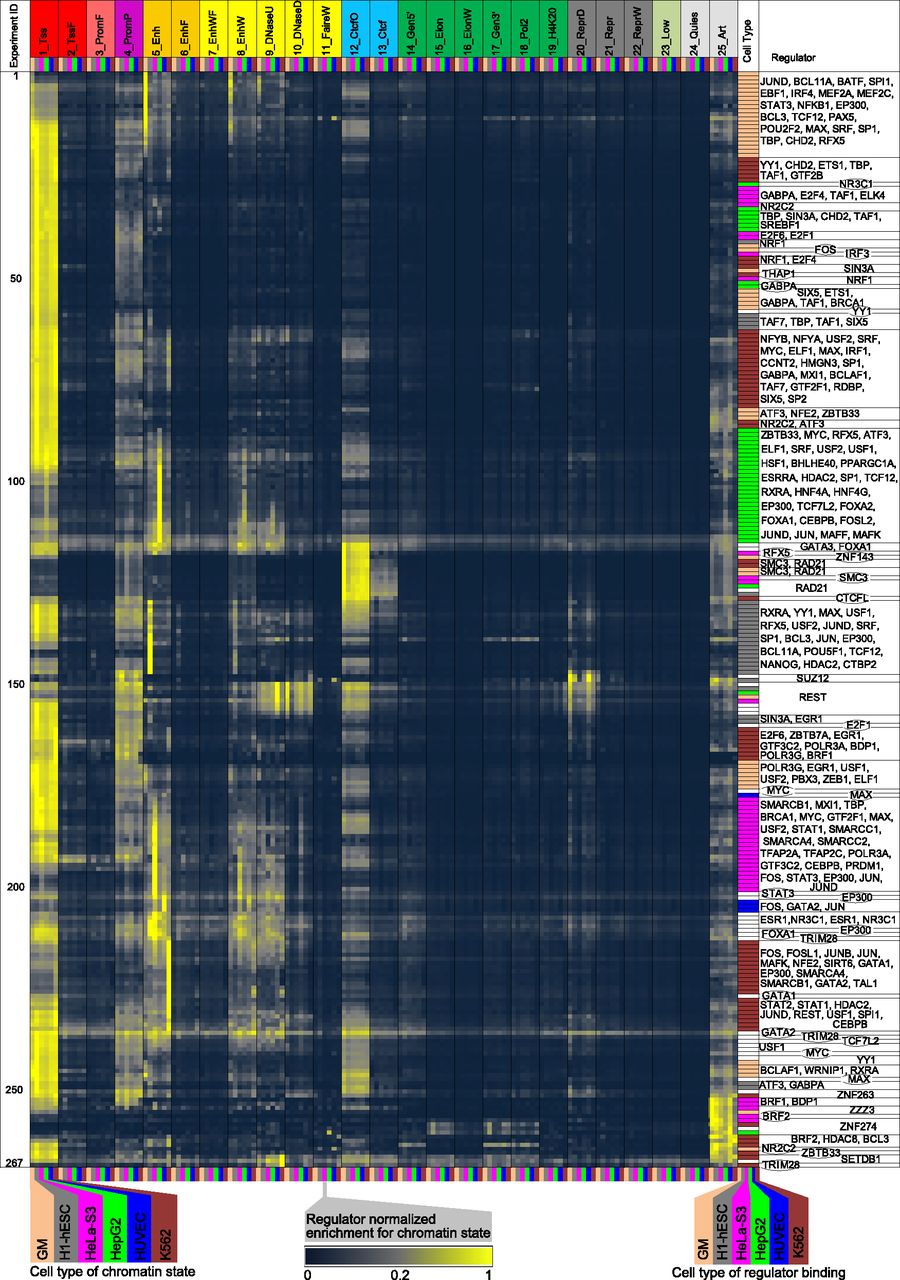
Dynamics of regulator enrichment in different chromatin states across cell types. Each row corresponds to one regulator in a given cell type. Each column corresponds to a state-cell type combination. The columns are organized first by state and then by cell type in the following order: Gm12878, H1-hESC, HeLa-S3, HepG2, HUVEC, and then K562. The rows have been automatically ordered computationally using a traveling salesman problem instance solver, and reveal both regulator and cell type groups. The fold enrichments have been row-normalized, scaled to the maximum enrichment in the row. In the six columns of each group, yellow indicates higher enrichment values and blue lower enrichment values. The next-to-last column indicates the cell type of the experiment color-coded, with all GM cell types colored the same and all other non-Tier 1 and 2 cell types colored white. The last column indicates the regulators of the experiments listed consecutively within the same cell type block.


