
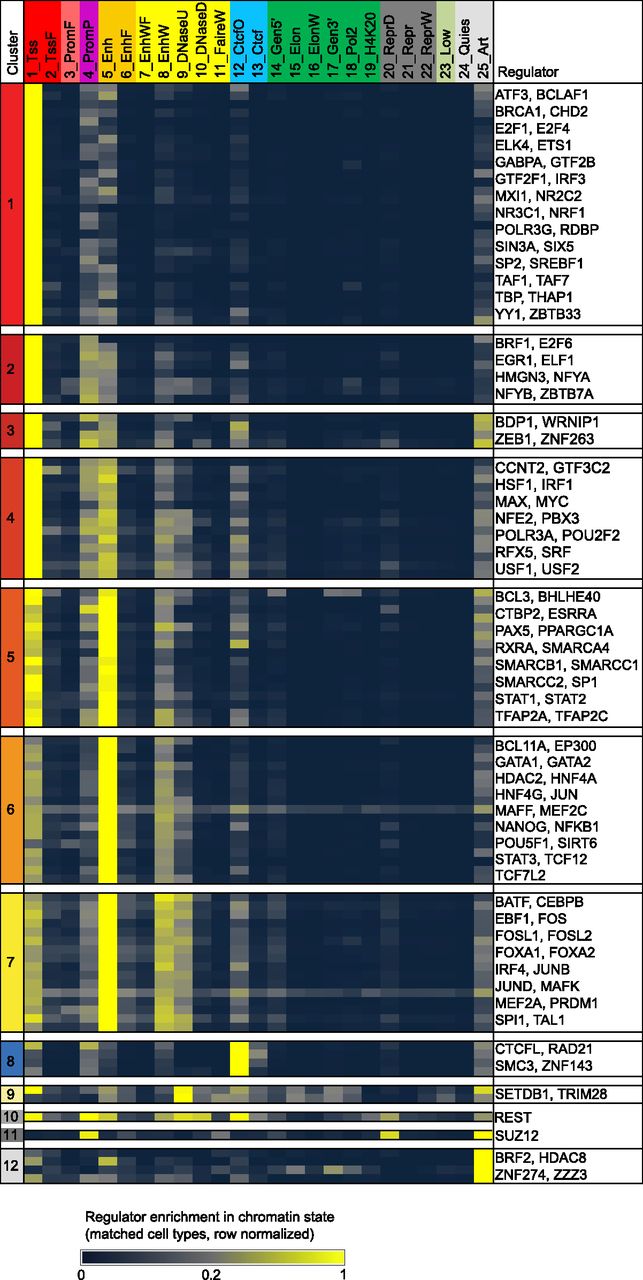
Figure 1.
Regulator enrichments for each chromatin state in matched cell types. Different regulators show distinct chromatin state preferences. For each regulator with matching chromatin data, the average enrichment is shown for each chromatin state (columns). Enrichments have been row-normalized, scaling by the largest enrichment value for each experiment. K-means clustering with 12 clusters produced the clusters labeled C1–C12.


