
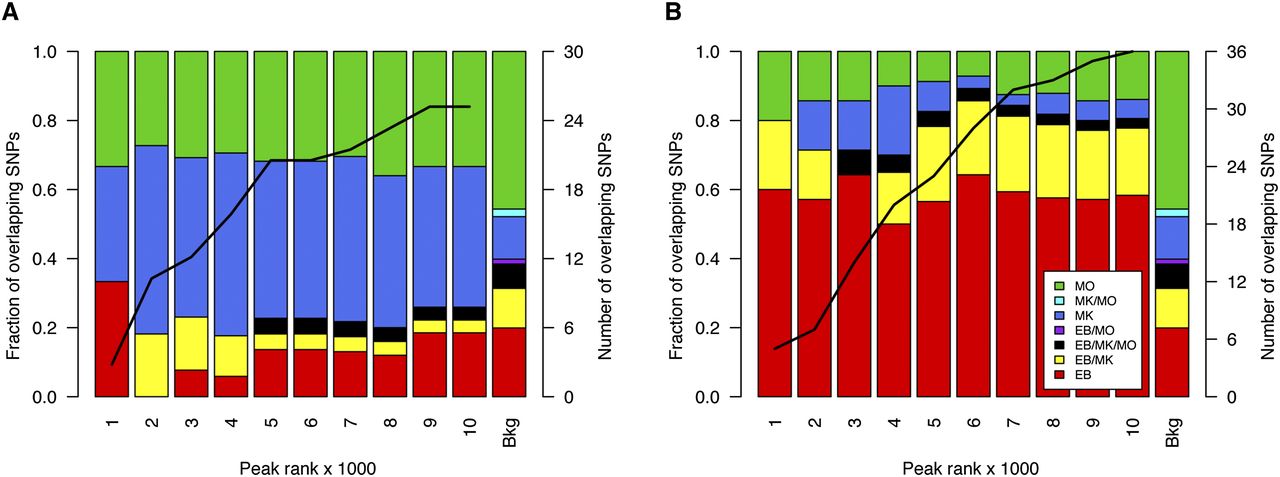
Cell type distribution of NDRs containing candidate functional variants. We considered GWA index SNPs associated with platelet (A) and erythrocyte (B) parameters, as well as their proxy SNPs in high LD (r2 > 0.8; located within 1 Mb of index SNPs). NDRs were ranked by signal strength (F-Seq peak score). Then, these rankings were used to divide the NDRs into cumulative tranches (x-axis) to investigate the impact of peak calling thresholds on results. For example, the first bar represents the tranche containing the 1000 top-ranked NDRs, whereas the penultimate bar represents the tranche containing the 10,000 top-ranked NDRs of each cell type. The bars summarize the cell type distribution of candidate functional SNPs at NDRs as a percentage of the tranche-specific total. The last bar, labeled “Bkg,” represents the expected cell type distribution for the SNPs under the null hypothesis. The solid line indicates the number of SNPs overlapping the tranche-specific NDRs. The results showed that for both platelet and erythrocyte QTLs, the candidate functional variants were most commonly found at MK- and EB-restricted NDRs, respectively. This was true across the spectrum of peak calling thresholds.


