
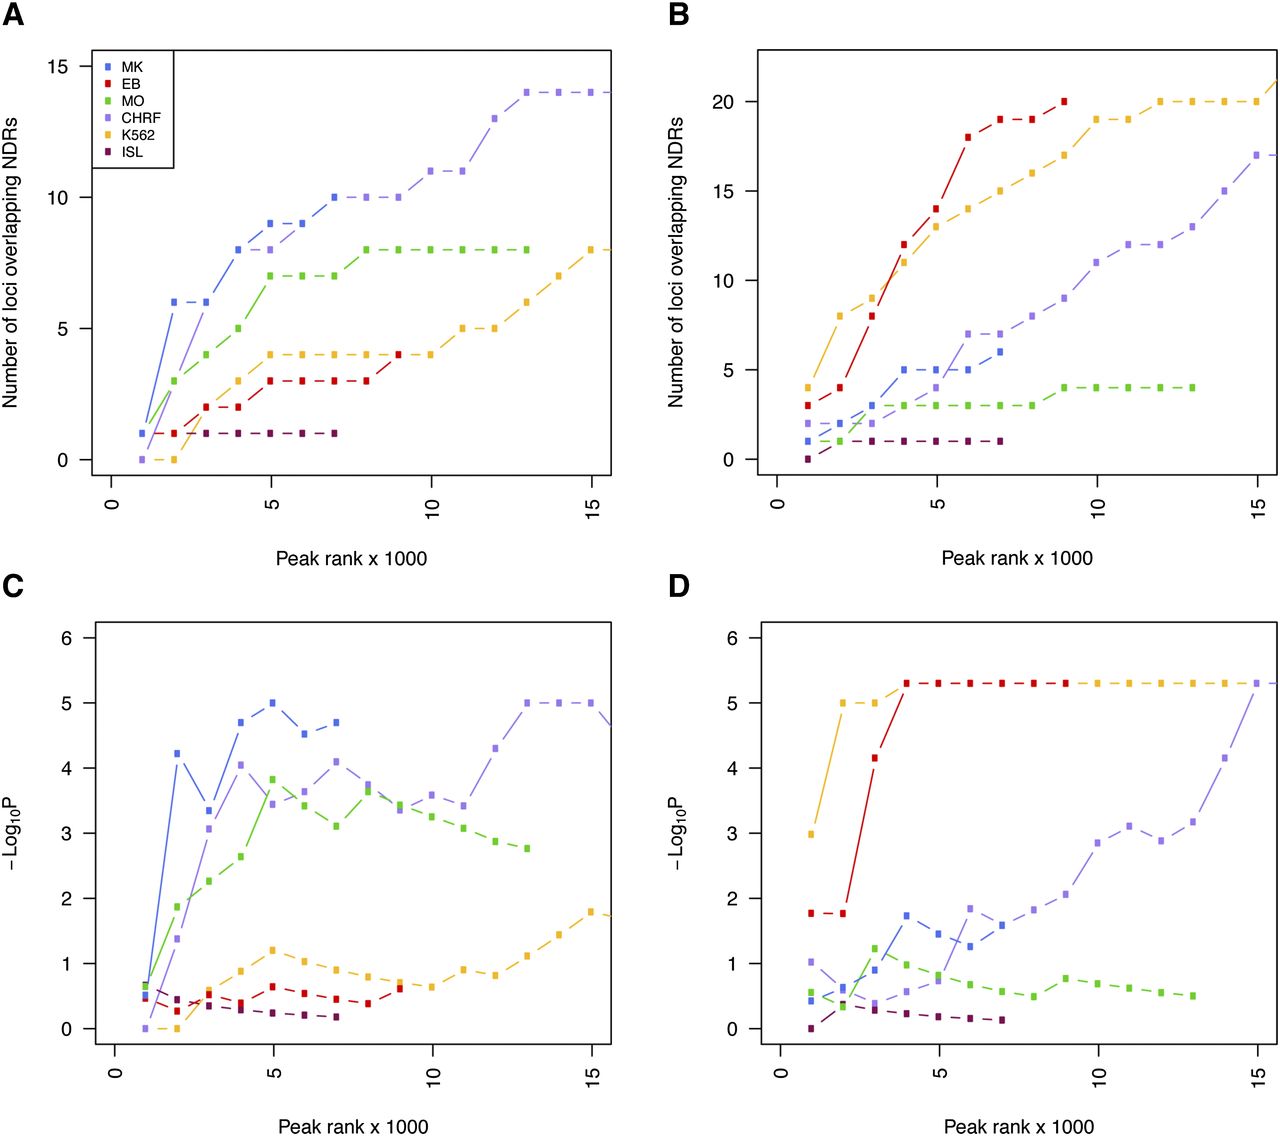
Cell type–dependent enrichment of GWA signals associated with hematological quantitative traits at NDRs. (A,B) Cumulative number of GWA loci harboring platelet (A) and erythrocyte (B) trait-associated SNPs at NDRs across different cell types as a function of rank tranches for decreasing NDR signal strength (F-Seq peak score). (C,D) To determine whether such overlap was expected by chance, we compared the number of overlapping SNPs with 100,000 random samples of 68 and 75 SNPs at the platelet (C) and erythrocyte (D) QTLs, respectively. These random sets of SNPs were matched for possible confounding factors such as minor allele frequency, distance to a TSS, and number of proxy SNPs per locus. The achieved significance level is displayed across the cumulative rank tranches to better appreciate the effect of increasing the number of NDRs in the analysis. The strongest enrichment of genome-wide significant sequence variants at platelet and erythrocyte QTLs was found at NDRs in MKs and EBs, respectively. However, the enrichment was equally clear at NDRs in the respective immortalized lines, i.e., CHRF-288-11 megakaryocytic cells and K562 erythroblastoid cells, respectively. NDRs identified in CHRF-288-11 cells but not MKs were enriched for SNPs associated with erythrocyte indices, indicative of the less differentiated state of cell lines of leukemic origin relative to the primary cells.


