
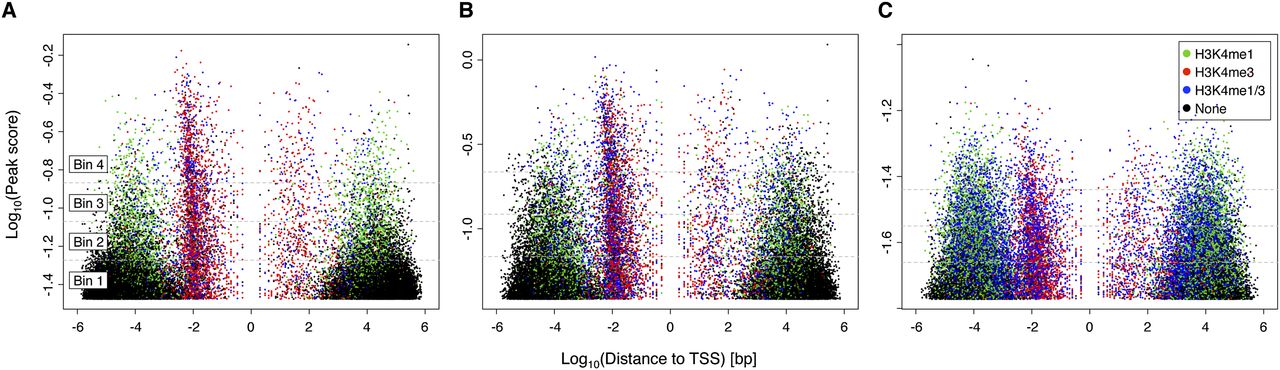
Overlap of H3K4me3 (promoter) and H3K4me1 (enhancer) histone marks with NDRs. In (A) MKs and (B) EBs, NDRs in the highest intensity bin (Bin 4) showed stronger overlap with gene promoters close to TSSs compared with NDRs in the lowest retained intensity bin (Bin 2), which showed stronger overlap with enhancer elements distal to the closest TSS. NDRs that did not overlap with histone marks were more likely to be in the lowest intensity bin and far from promoters. (C) In MOs, however, we found that NDRs in the highest intensity bin were depleted close to the TSS compared with MKs and EBs. The peak bins are indicated with a dashed gray line. These results suggest that NDRs of different signal strength may have different functional properties.


