
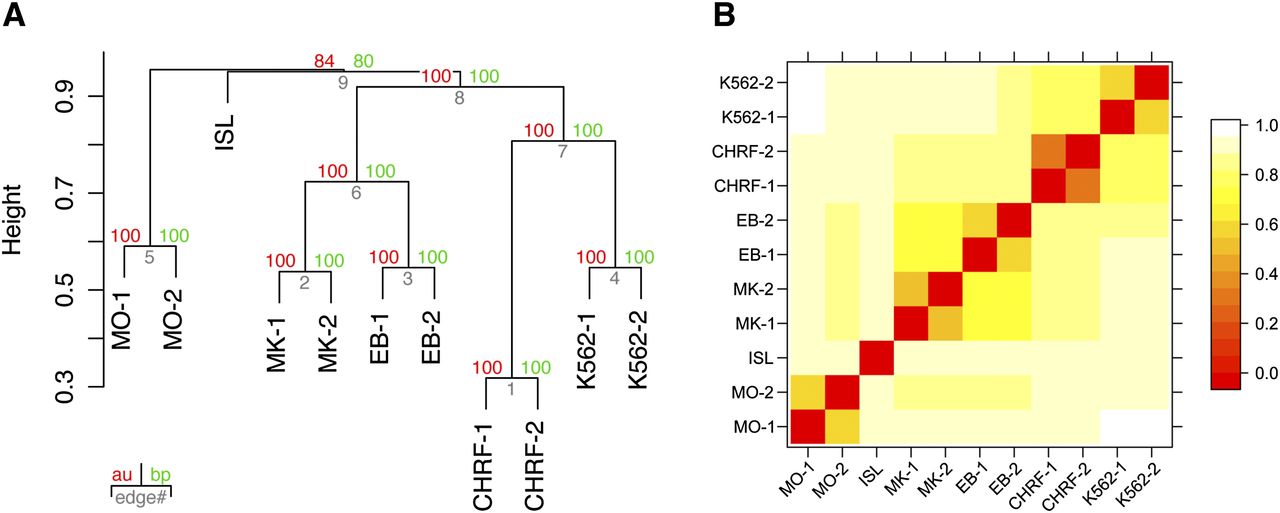
Hierarchical clustering of the overlap of FAIRE-derived nucleosome-depleted regions (NDRs). (A) The hierarchical clustering is based on the overlap of NDRs across different cell types, as shown in Supplemental Figure 2. The dendrogram shows that the clustering is dominated by cell type identity rather than individual preparation. The observed hierarchical tree mirrors the hematopoietic tree, where MKs and EBs share a common progenitor. MKs and EBs do not co-cluster with their representative cell lines, i.e., CHRF-288-11 and K562, respectively, indicating that the open chromatin structure of immortalized lines does not fully reflect that of primary cells. Both MOs and pancreatic islets form out-groups, due to the limited overlap of NDRs with the other cell types tested. This suggests that MOs, despite being one of the myeloid types of cells akin to MKs and EBs, have a marked different open chromatin profile. The hierarchical cluster analysis was performed using the R package Pvclust (distance: binary; cluster method: complete) (Suzuki and Shimodaira 2006). The uncertainty of the clustering was assessed using bootstrap resampling. (B) The heatmap of the binary distances complements the cluster plot. Relationships between NDRs across all samples are observable. The binary distances were plotted using the levelplot function of the R package lattice (http://cran.r-project.org/web/packages/lattice/). (MO) Monocyte; (MK) megakaryocyte; (EB) erythroblast; (ISL) pancreatic islet; (CHRF) CHRF-228-11 megakaryocytic cell; (K562) K562 erythroblastoid cell; (au) approximately unbiased P-value; (bp) bootstrap probability value.


