
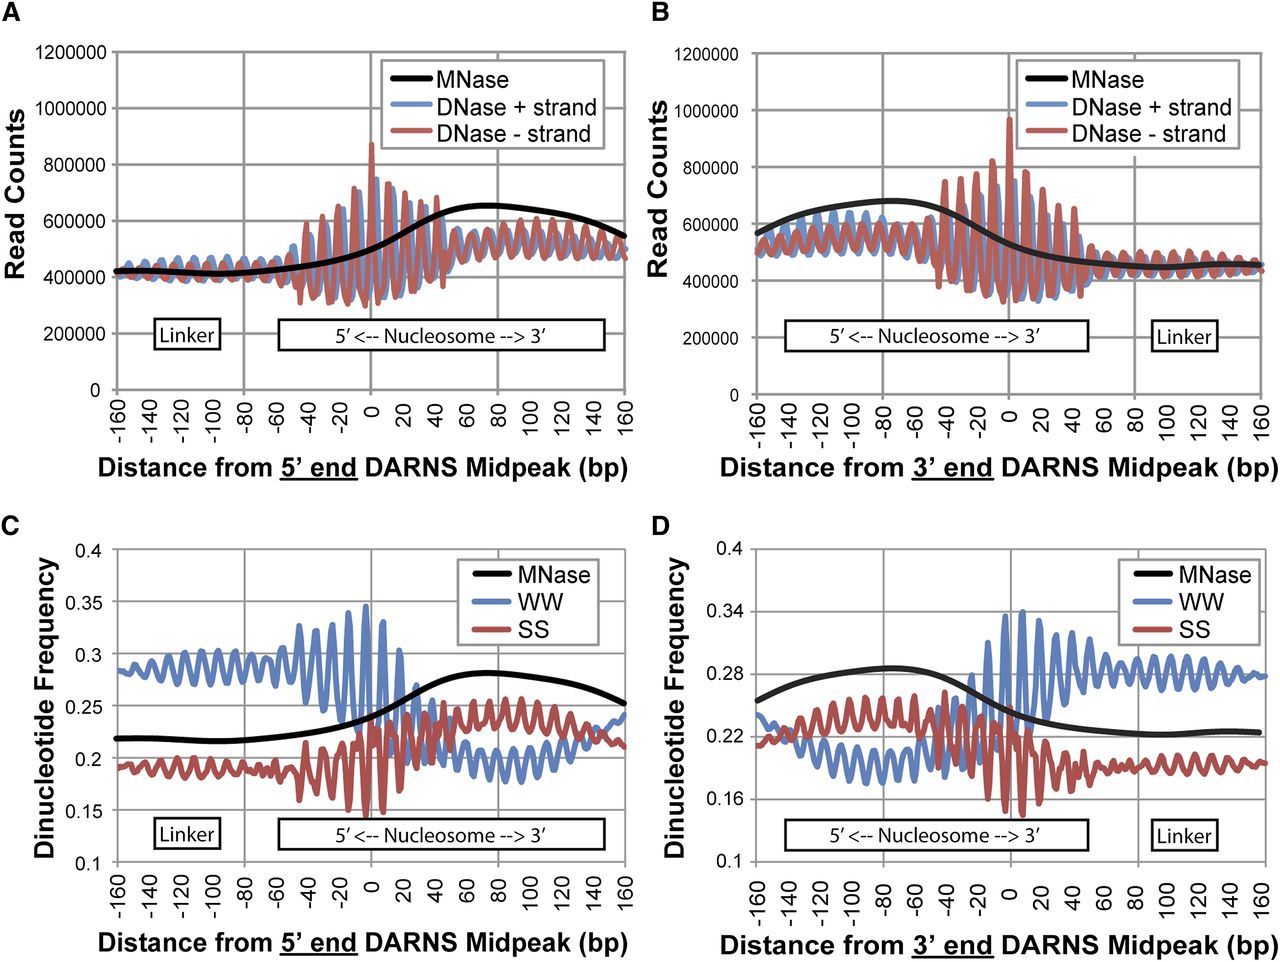
Properties of DARNS that map to the 5′ end or 3′ end of nucleosomes. In vitro dyads (Valouev et al. 2011) were used to distinguish DARNS that mapped to either the 5′ end (A,C) or the 3′ end (B,D) of the nucleosome (for details, see Methods). (A) DNase reads aligned by centermost negative-strand correlation peak (midpeak) of DARNS that map to the 5′ end of the nucleosome exhibit a greater oscillation pattern and DNase signal on the 5′ end of the nucleosome compared to either the linker or the 3′ end of the nucleosome. In vivo LCL MNase-seq signal is transposed on top (black line) to help designate the locations of the nucleosome and the linker (indicated at bottom). (B) Same as A, but for DARNs that map to the 3′ end of the nucleosome. (C,D) Same plot as A and B, but showing dinucleotide (W = A/T, S = C/G) frequency. Note that the central peak in the SS dinucleotide signal aligns to the midPeak of the DARNS, suggesting that they occur when the minor groove is exposed.


