
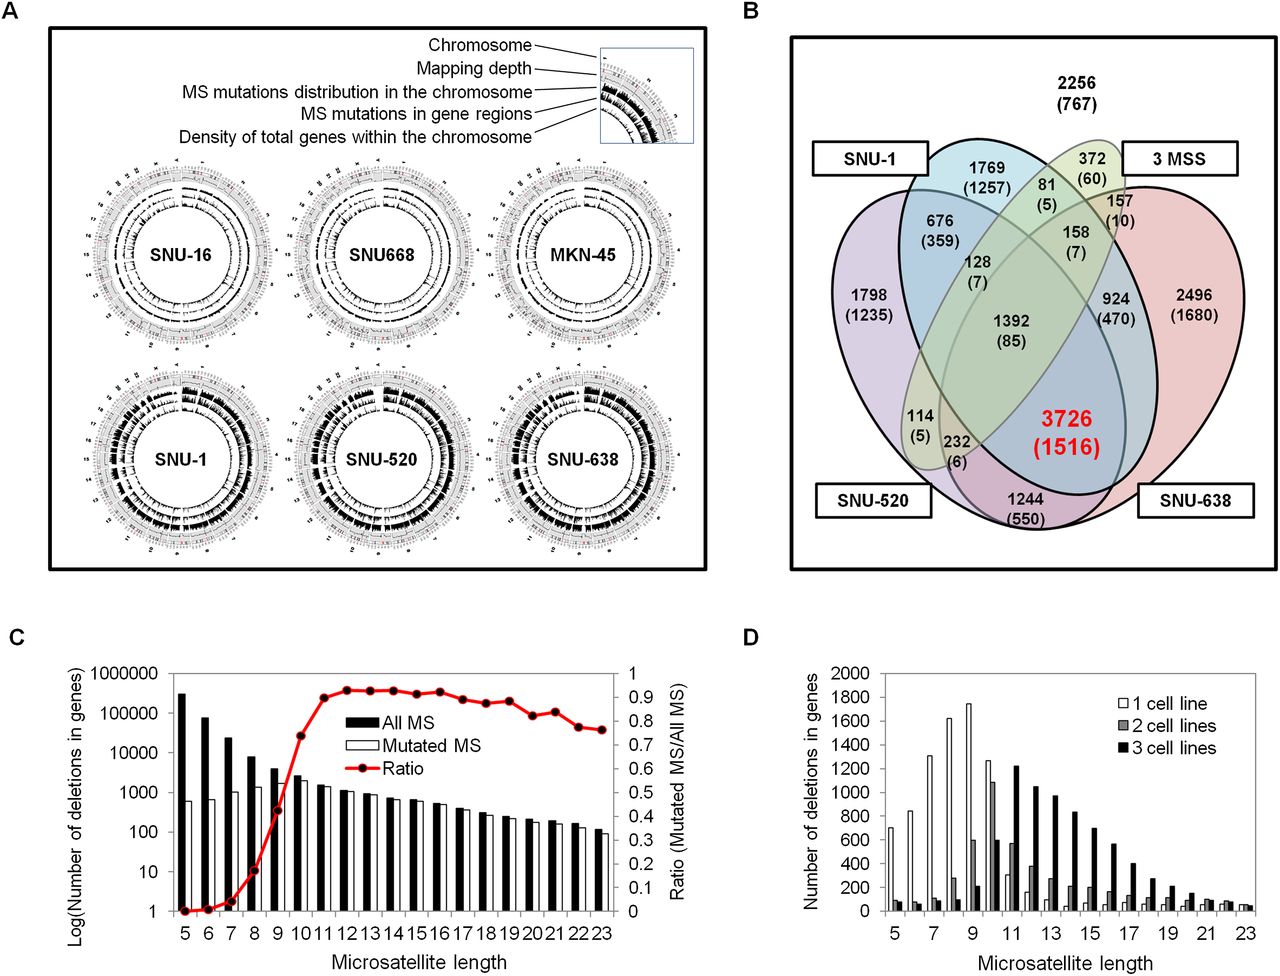
The landscape of MS mutations in human gastric cancer. (A) Graphical representation of six gastric cancer genomes in a Circos plot (Krzywinski et al. 2009). Remarkable differences in the number of MS mutations were identified in three MSI-H cell lines, with mapping depth and gene density displaying similar patterns. (B) Venn diagram depicting the dispersion of MS mutations in CDS and UTRs of genes between three MSI-H and sum of three MSS gastric cancer cell lines from whole-genome sequencing. The overlapping regions indicate the number of length alterations in gene regions that the cell lines have in common. The number of novel genes is displayed in parentheses. (C) Comparisons between mutated repeat tracts (mutated MS) and all existed repeat tracts (all MS) in gene regions in which both contain five or more mononucleotides in length (A/T and G/C) are displayed as ratios. (D) Length distribution of mononucleotide repeat instabilities in gene regions found in one, two, or all three MSI-H cell lines.


