
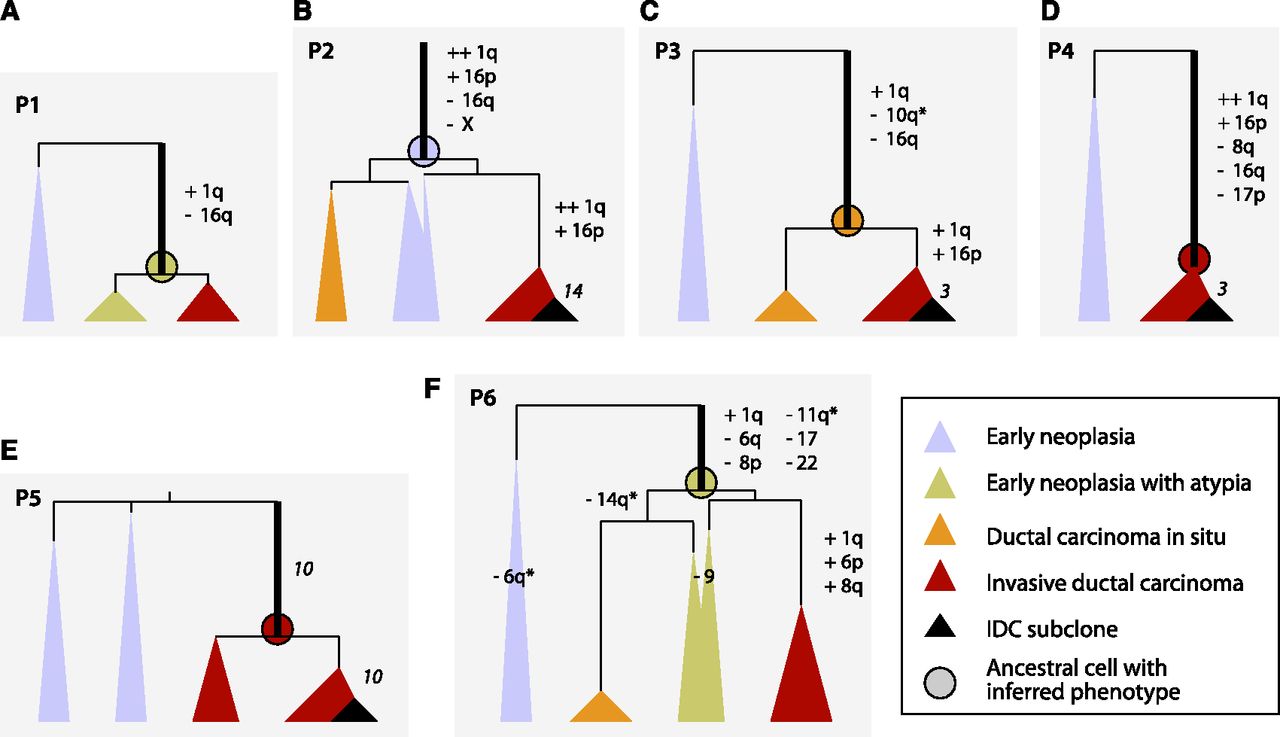
Genome evolutions of all patients (P1–P6). Vertical black lines are ancestral lineages whose lengths are proportional to the number of SNVs that occurred in each (except Patient 4, which is 50% shorter for fit). Cones represent tissue samples; cone width represents approximate amount of tissue; cone height is constrained at the top by the position of the last common ancestral cell of the sample, which is determined by the ancestral branch lengths, and on the bottom by the time of surgery, which is the same for all samples. The ratio of cone width to height is an approximation of the rate of cell division in each sample since the last common ancestral cell. Chromosome ploidy changes are indicated with the chromosome number; stand-alone numbers in italics indicate the number of chromosomes affected by subclone evolution (or putative chromothripsis in Patient 5). Thick branches are the earliest branches for which we are able to infer genomic events. Circles at the end of thick branches are ancestors with the colors denoting their inferred neoplasia-like, DCIS-like, or IDC-like phenotypes.


