
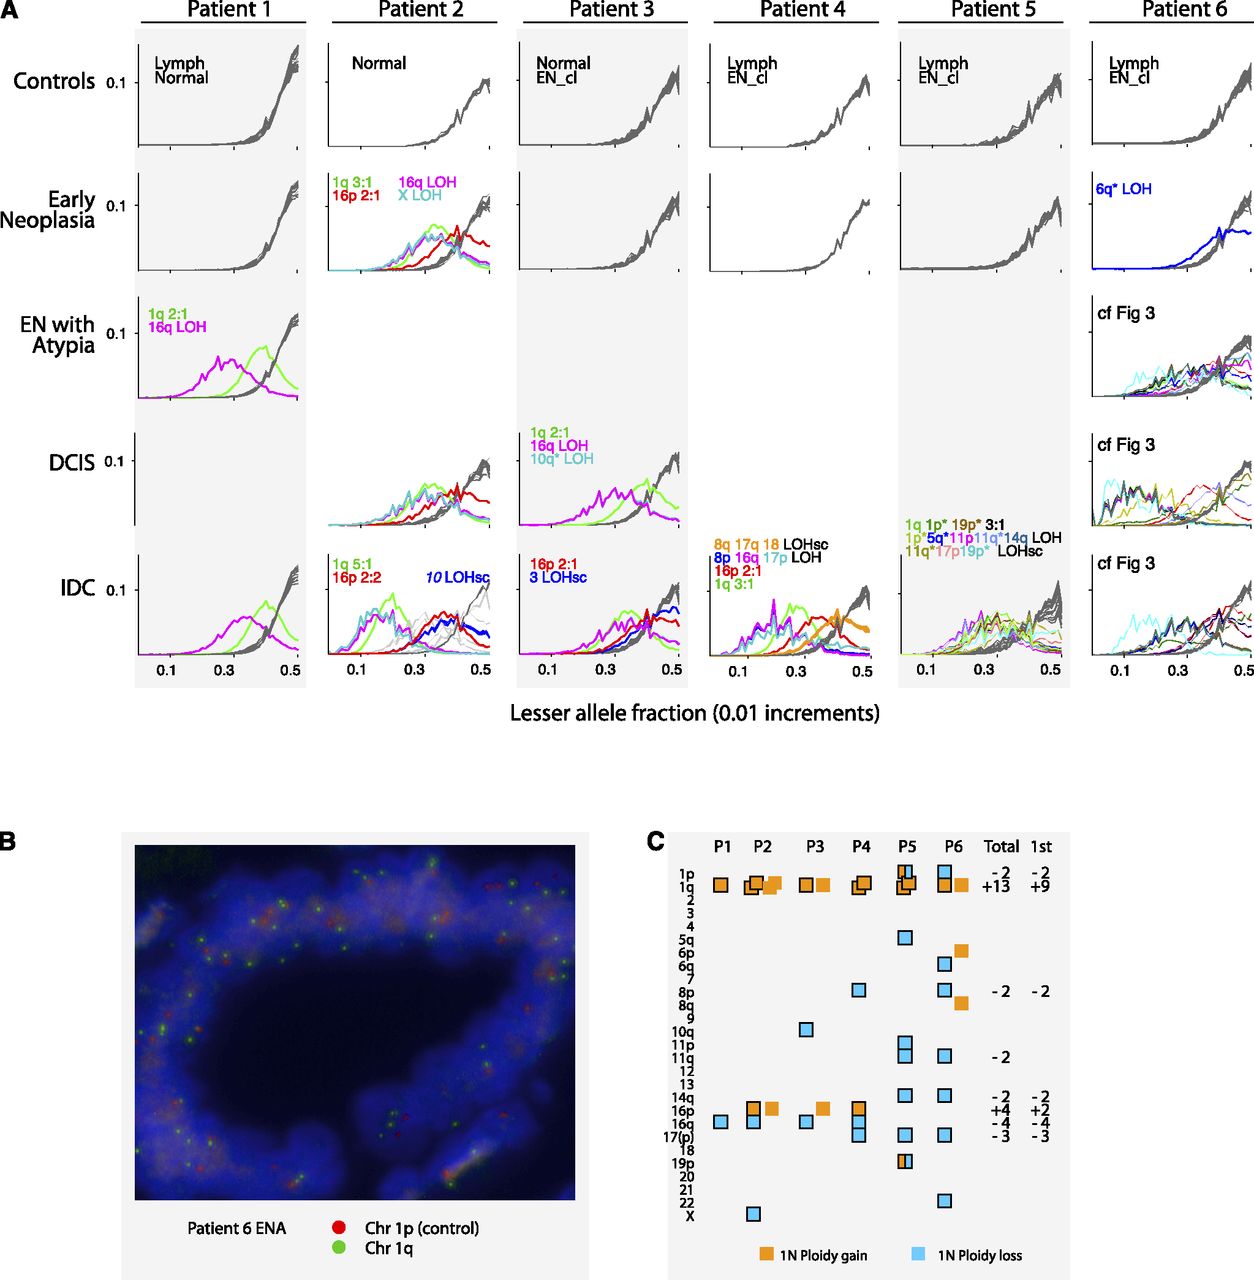
Aneuploidy summary. (A) LAF distributions for each chromosome across all patients and samples. In each sample-by-patient panel, the LAF distributions of all chromosomes are superimposed. In the absence of aneuploidy, the plot lines of all chromosomes are well-aligned, as is evident in the control plots and some EN plots. Control panels often contain plots from two samples (indicated) and so there are sometimes 46 lines superimposed, revealing the robustness of the LAF metric across samples and chromosomes. A chromosome's plot line is gray when it does not deviate from the typical distribution. The line is colored when the chromosome's LAF is skewed. Distinct colors are assigned to represent aneuploid regions that recur in different samples and patients. Colors are labeled in the panel in which they first appear. For Patient 6 please see Figure 3. (B) FISH of chromosome 1 in ENA of Patient 6. (C) Distribution of aneuploidies by patient, excluding those in IDC subclones. Each square denotes a unit gain (orange) or loss (blue). In Patients 2, 3, and 6, two phases of aneuploidies occurred, with those of the second phase not surrounded by a border. (Total) The total number of chromosomes lost (−) or gained (+) across all patients; (1st) the number during the first detected phase. Only recurrent events are listed. In Patient 5 (which exhibits hallmarks of chromothripsis), different pieces of chromosomes 1p and 19 underwent simultaneous losses or gains.


