
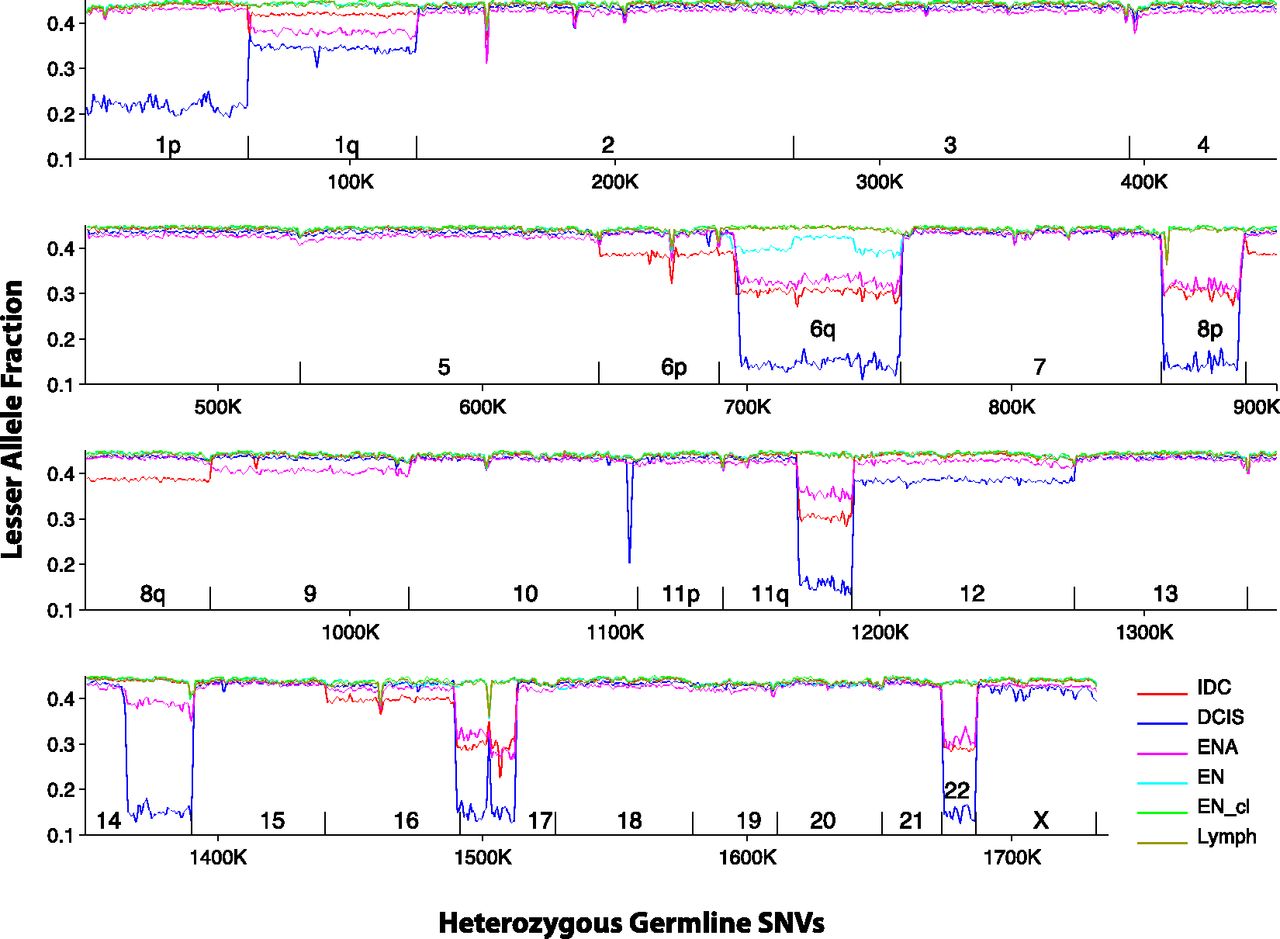
Figure 3.
Lesser allele fraction plot of Patient 6. SNVs are arranged by their order in the genome, and LAF is plotted for each sample in windows of 1000 SNVs with 500 SNV overlap. Aneuploidies are visible as precipitous drops in the LAF, which are often shared between samples. Chromosome boundaries are indicated by short vertical lines. All samples are plotted and give highly consistent LAFs for chromosomes that are euploid.


