
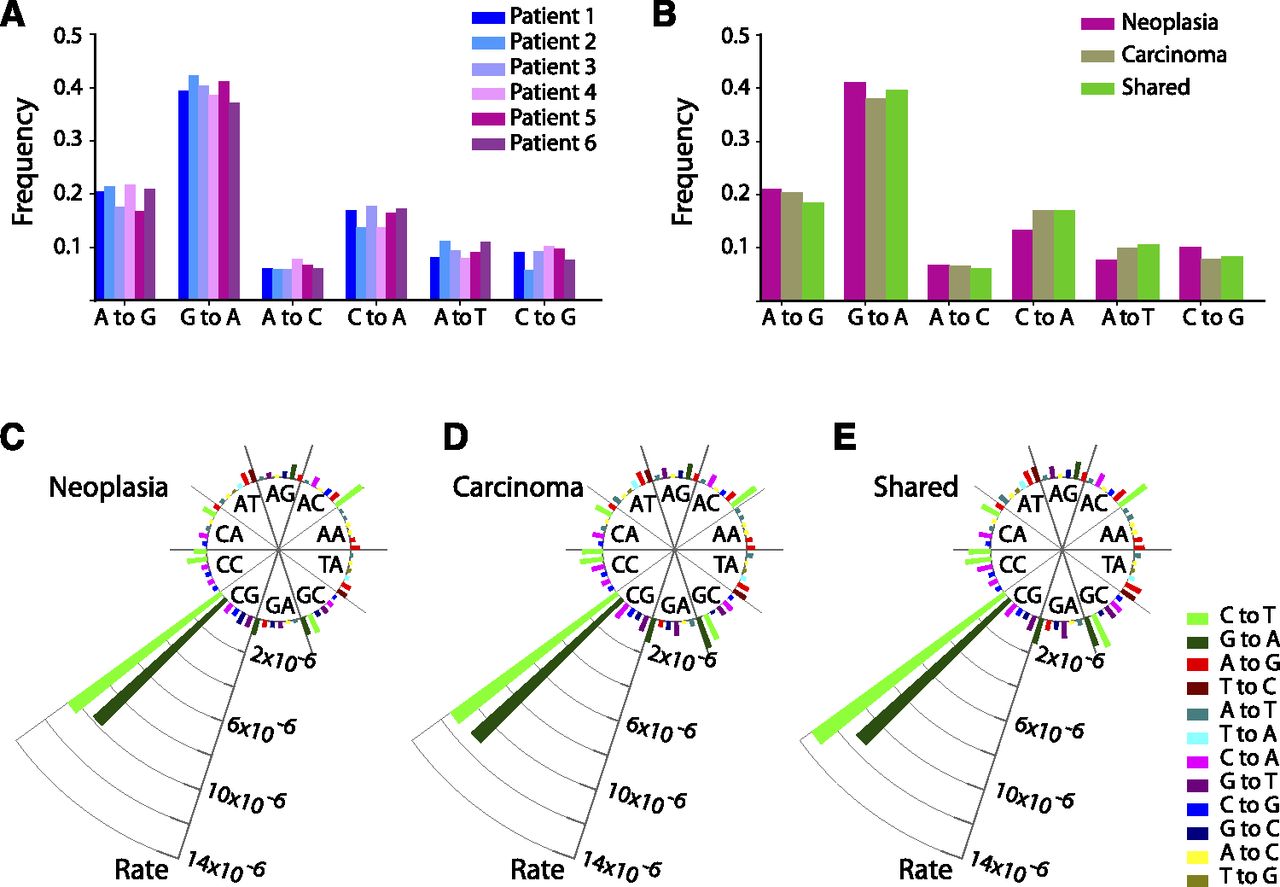
Figure 2.
Mutation spectra and rates of somatic SNVs. (A) Mononucleotide substitution frequencies by patient. (B) Mononucleotide substitution frequencies by SNV class. (C) Dinucleotide substitution rates of SNVs private to early neoplasias. (D) Dinucleotide substitution rates of SNVs private to carcinomas. (E) Dinucleotide substitution rates of SNVs shared among neoplasias and carcinomas. For C–E, SNVs are pooled across patients. The mutated dinucleotide is indicated in the inner circle, and the substitution occurring within it is color coded. Rate is defined as mutations per dinucleotide of that class.


