
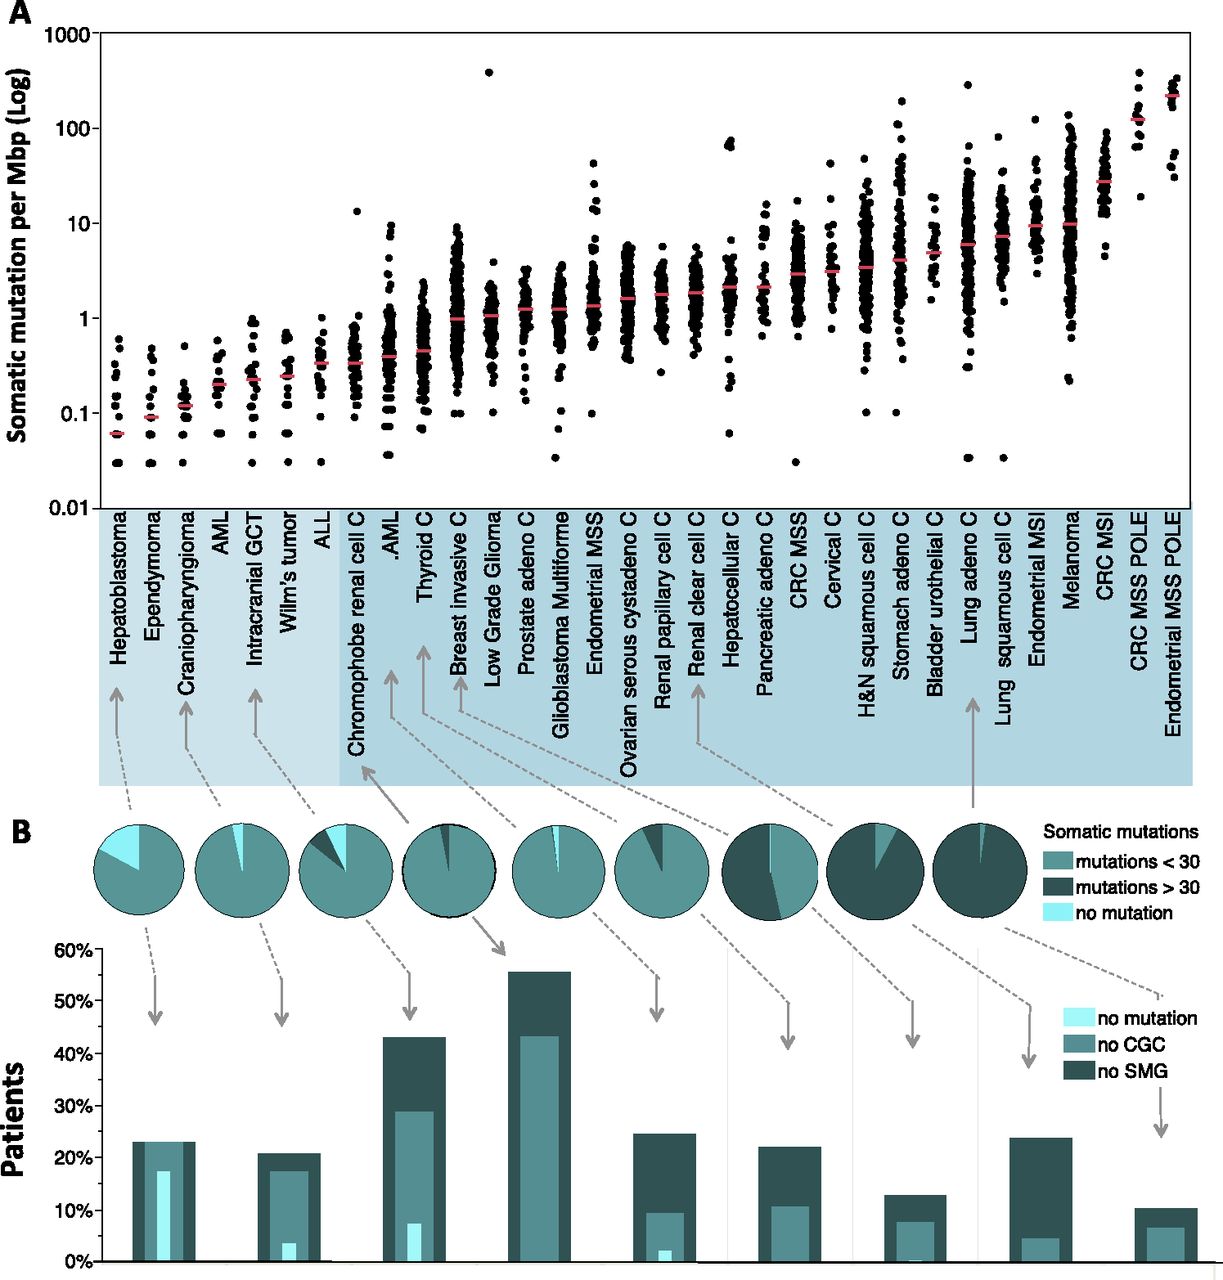
Frequencies of somatic mutations in cancer patients. All data represents primary tumors. Only nonsilent mutations (missense, nonsense, frameshift, and splice site) were counted. (A) Overall frequencies of somatic mutations. Each black dot represents a tumor. The light blue shaded group indicates pediatric tumors, and the deeper blue shaded group indicates adult tumors. Red horizontal lines within each cluster of points indicate median value of the mutation frequency of each tumor type. (ALL) Acute lymphoblastic leukemia; (AML) acute myeloid leukemia; (C) carcinoma; (GCT) germ cell tumor; (CRC) colorectal carcinoma; (MSI) microsatellite instability; (MSS) microsatellite stable; (POLE) patients with somatic mutation in the nuclease (proofreading) domain of the POLE gene. The outlier in the low-grade glioma patient with >100 mutations per Mb is also POLE-mutated. (B) Frequency classification of tumors. The pie charts divide the patients into three groups based on frequency of nonsilent mutation: 0 detectable somatic mutations, less than 30, and greater than or equal to 30 for selected representative tumor types (30 mutations represent a frequency of 1 per Mbp in A). The nested histograms below the pie charts show the percentage of patients with no significantly mutated genes (SMG, calculated by MutSig, q ≤ 0.1), no cancer census genes (CGC), or no mutations at all. The sequencing data for all the pediatric tumors, CRC, and hepatocellular carcinoma were generated at the Human Genome Sequencing Center at Baylor College of Medicine. The sequencing data for all other adult tumors were from the TCGA Genome Data Analysis Center (https://confluence.broadinstitute.org/display/GDAC/Home). Pediatric AML, ALL, and Wilm's Tumor data were obtained from the TARGET project (http://www.targetproject.net/).


