
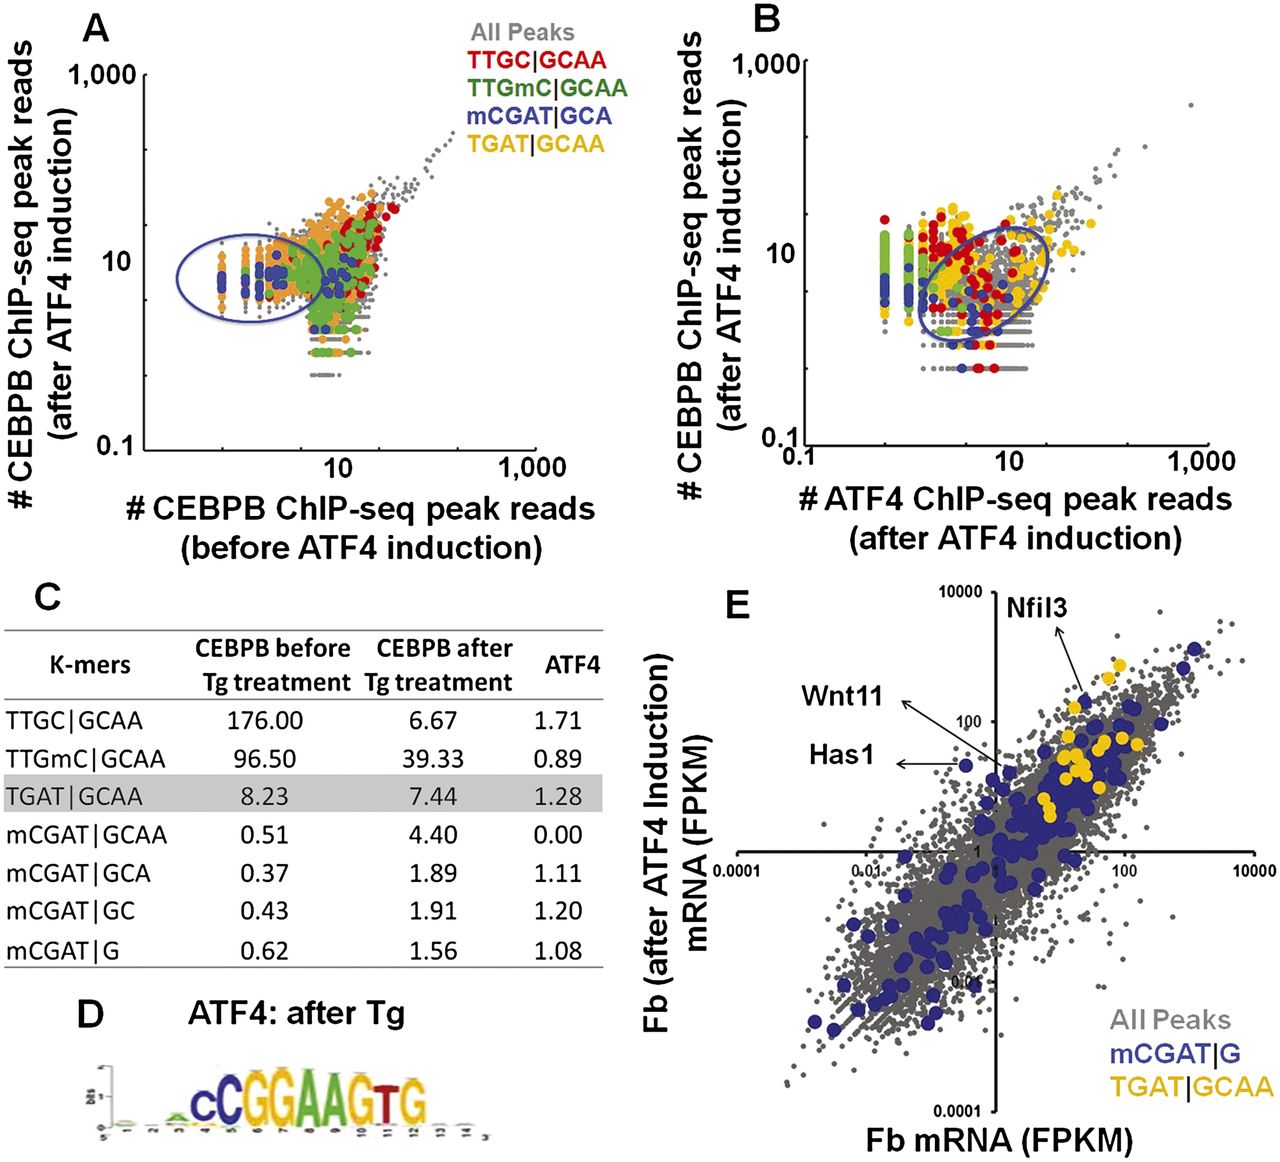
(A) Number of reads normalized to the total number of reads in the CEBPB ChIP-seq peaks before and after ATF4 induction by Tg in mouse primary dermal fibroblasts. (Green) Peaks containing methylated canonical CEBP 8-mer; (blue) CGAT|GCA-containing peaks; (yellow) TGAT|GCAA-containing peaks. (B) Number of reads normalized to the total number of reads in the CEBPB ChIP-seq peaks vs. ATF4 ChIP-seq peaks after ATF4 induction by Tg in mouse primary dermal fibroblasts. Peaks containing methylated canonical CEBP 8-mer are colored as in Figure 6A. (C) Enrichment of selected k-mers in CEBPB ChIP-seq peaks before and after thapsigargin treatment and ATF4 ChIP-seq peaks after thapsigargin treatment. (D) Motif identified using RSAT from ATF4 ChIP-seq peaks after treatment with Tg. (E) Transcript abundances as determined using RNA-seq were plotted for dermal fibroblasts before and after ATF4 induction. Transcript abundances were reported in fragments per kilobase of transcript per million fragments mapped (FPKM). The peaks are color-coded: all peaks (gray); TGAT|GCAA (yellow)–commonly bound CEBPB and ATF4 ChIP-seq peaks (in promoters); CGAT|G (blue)–(nearest gene to the ATF4 ChIP-seq peaks). Approximately 50% of the promoters had no signal and are not shown.


