
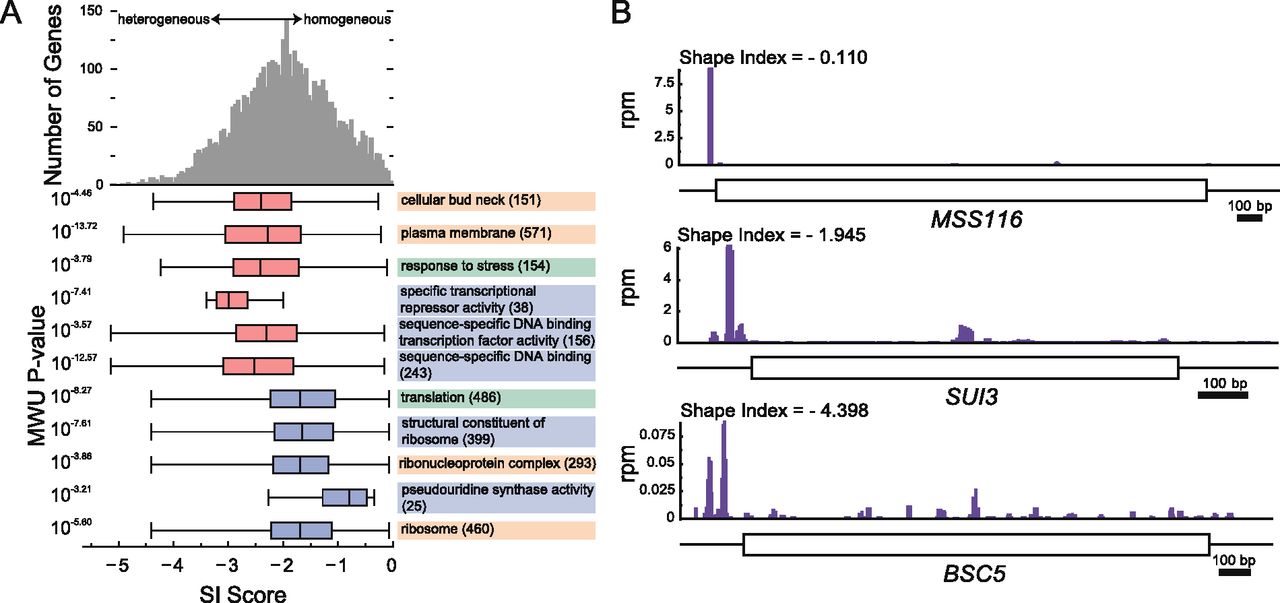
Figure 6.
There is intragenic TL heterogeneity. (A) SI scores of GO categories with 10 or more genes were compared to all genes (top histogram). GO categories with a significantly different SI score distribution (Bonferroni-corrected Mann Whitney U P < 0.001) are shown, with number of genes in parentheses. Box and whisker plots indicate quartiles and range; red/blue shading indicates decreased/increased SI. Shading of GO categories indicates process (green), component (orange), or function (blue). (B) Three examples of genes with different shape index (SI) scores.


