
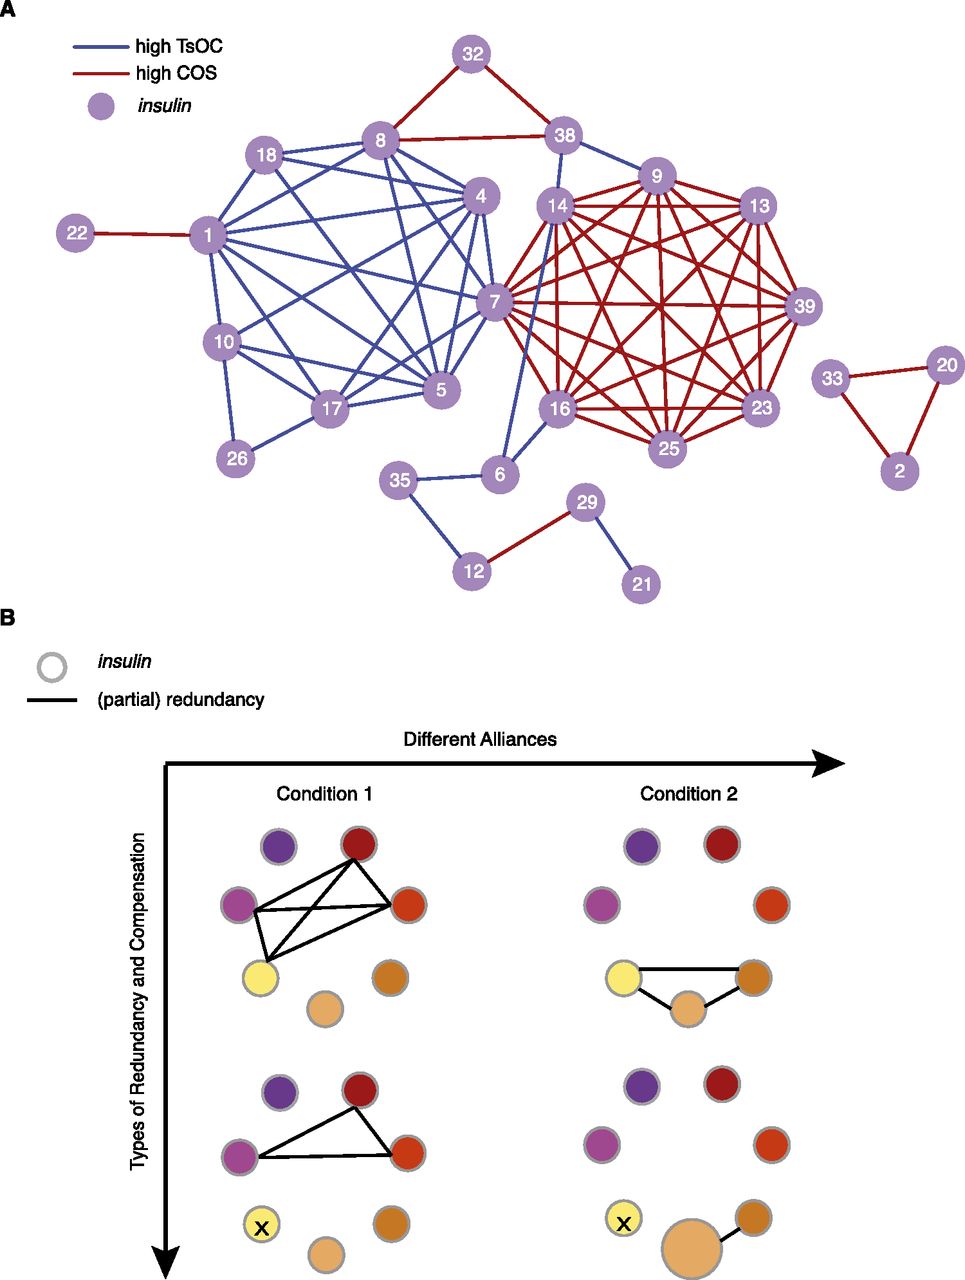
Model for complexity and robustness in gene families. (A) A coexpression network of the insulins (circles) that share the top 5% average TsOC through six larval/adult stages (blue edge) and the top 5% of conditional overlap (COS; red edge). Distinct clusters are observed whereby no insulins are both connected through high TsOC and high COS. (B) A model of “block design” or “alliances” in insulins under a given condition. A colored node represents one insulin. An edge represents overlapping function. Different alliances allow for the appropriate response to different conditions (top row). Although different conditions likely require different insulins, some (yellow node) may always be shared between conditions. Loss of single insulin activity does not cause a phenotypic affect due to redundancy (bottom, left) and/or compensation (bottom, right) with other insulins.


