
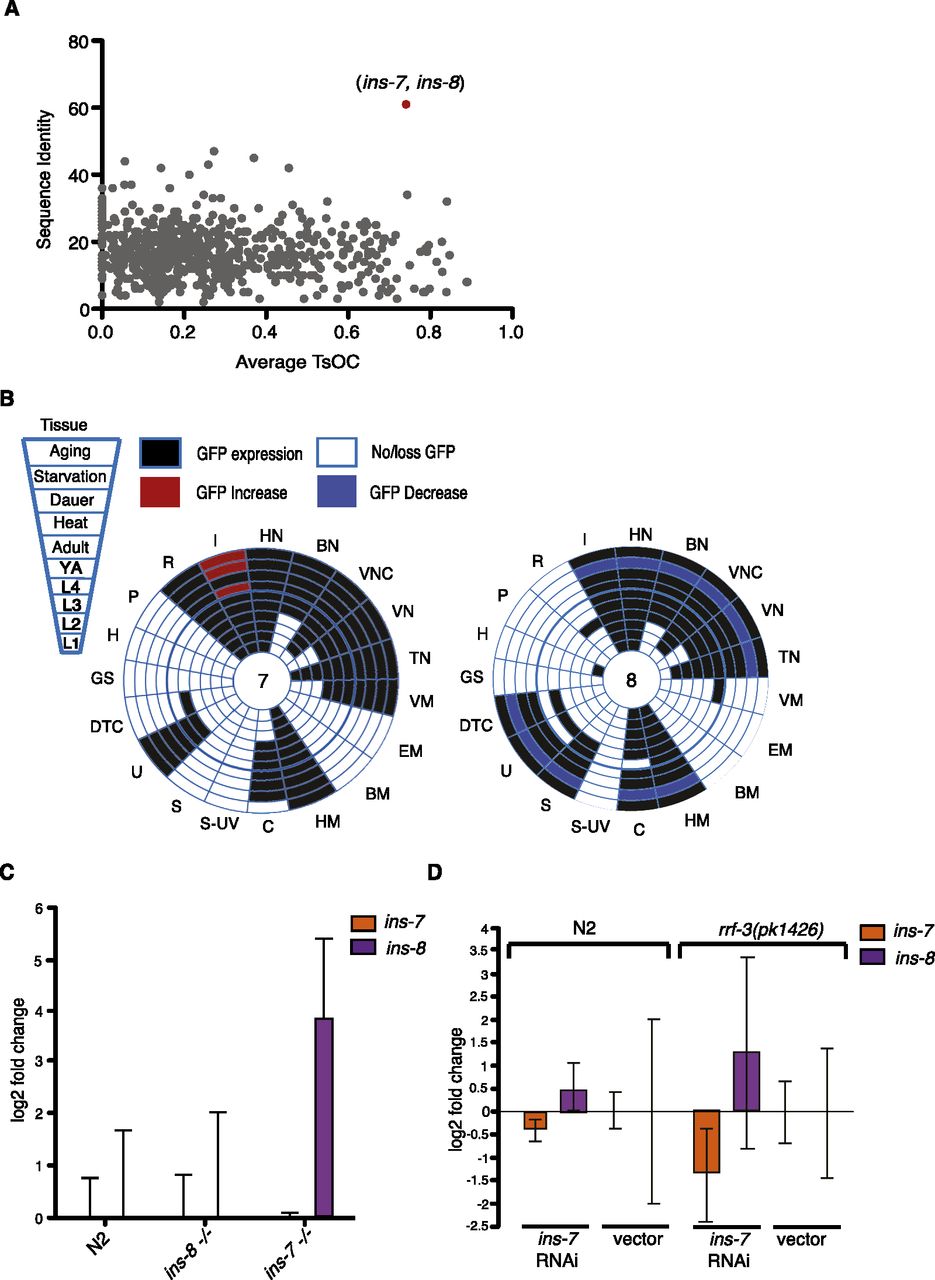
Divergence, overlap, and compensation in expression between ins-7 and ins-8. (A) There is no clear positive correlation between the degree of overlap in expression through development (average TsOC) and sequence similarity of insulins. ins-7 and ins-8 (red dot) are the only pair that share both high-sequence similarity and high TsOC. TsOC is presented as an average of the six TsOC values for each developmental stage. (B) ins-7 and ins-8 exhibit high overlap in expression under standard laboratory conditions (first six rings, from L1 to adult), but exhibit different conditional changes in expression (four outermost rings). (Red) GFP increase; (blue) GFP decrease; (black) no change in GFP expression; (white) no GFP observed. (C) In the absence of ins-7 (orange), ins-8 (purple) expression is increased. (D) ins-8 increases in both wild-type (N2) (P < 0.0001) and rrf-3(pk1426) mutants (P = 0.054) upon RNAi knockdown of ins-7. mRNA abundance was measured by qRT-PCR for C and D. Triplicate repeats from biological duplicate samples were measured. One biological sample is illustrated here. The error bar indicates variation between triplicates. P-values were calculated using a Student's t-test.


